Partizipative Kartierung in Osttimor

Das Team des Climate Centers hat die Aufgabe, die Internationale Rotkreuz und Rothalbmond-Bewegung und ihre Partner bei der Verringerung der Auswirkungen des Klimawandels und extremer Wetterereignisse auf gefährdete Menschen zu unterstützen.
Das Anticipatory Action Team führte ein Pilot-Projekt in Osttimor durch, um vorausschauendes Kartieren mit OpenStreetMap (OSM) zu implementieren. Dieses Projekt hat das Ziel, den Mangel an Basisdaten zu beheben, welche für die Planung wirksamer Präventionsmaßnahmen in der Region erforderlich sind.
Das Projekt
Dieses Projekt zielte darauf ab, das vorausschauende Kartieren in gefährdeten Gemeinschaften in Osttimor zu verbessern, indem OSM-Daten erstellt und genutzt wurden.
Durch die Bereitstellung präziser Informationen unterstützte das Projekt die Entwicklung proaktiver Strategien und die Einführung von Frühwarnsystemen zur Minderung der von Naturgefahren ausgehenden Risiken. Ein wichtiges Ziel war die Erforschung innovativer Methoden zur Erfassung des Wissens der Gemeinschaft über historische Überschwemmungen, deren Auswirkungen auf die Gemeinschaft und über bereits bestehende Frühwarnsysteme.
Im Rahmen einer ausführlichen landesweiten Multi-Gefahren-Analyse wurden Gebiete mit hohem Risiko identifiziert, was zur Priorisierung der Kartierung dieser Gebiete mit OSM führte. Die gemeinschaftliche Kartierung mit dem Sketch Map Tool war Teil einer umfassenderen Bemühung, die mit der Fernerkundung und lokaler Kartierung begann, um Gebäudedaten von Wohngebäuden und kritischen Infrastrukturen in OSM mit Hilfe von KOBO-Erhebungen zu verbessern.
Warum wurde das Sketch Map Tool verwendet?
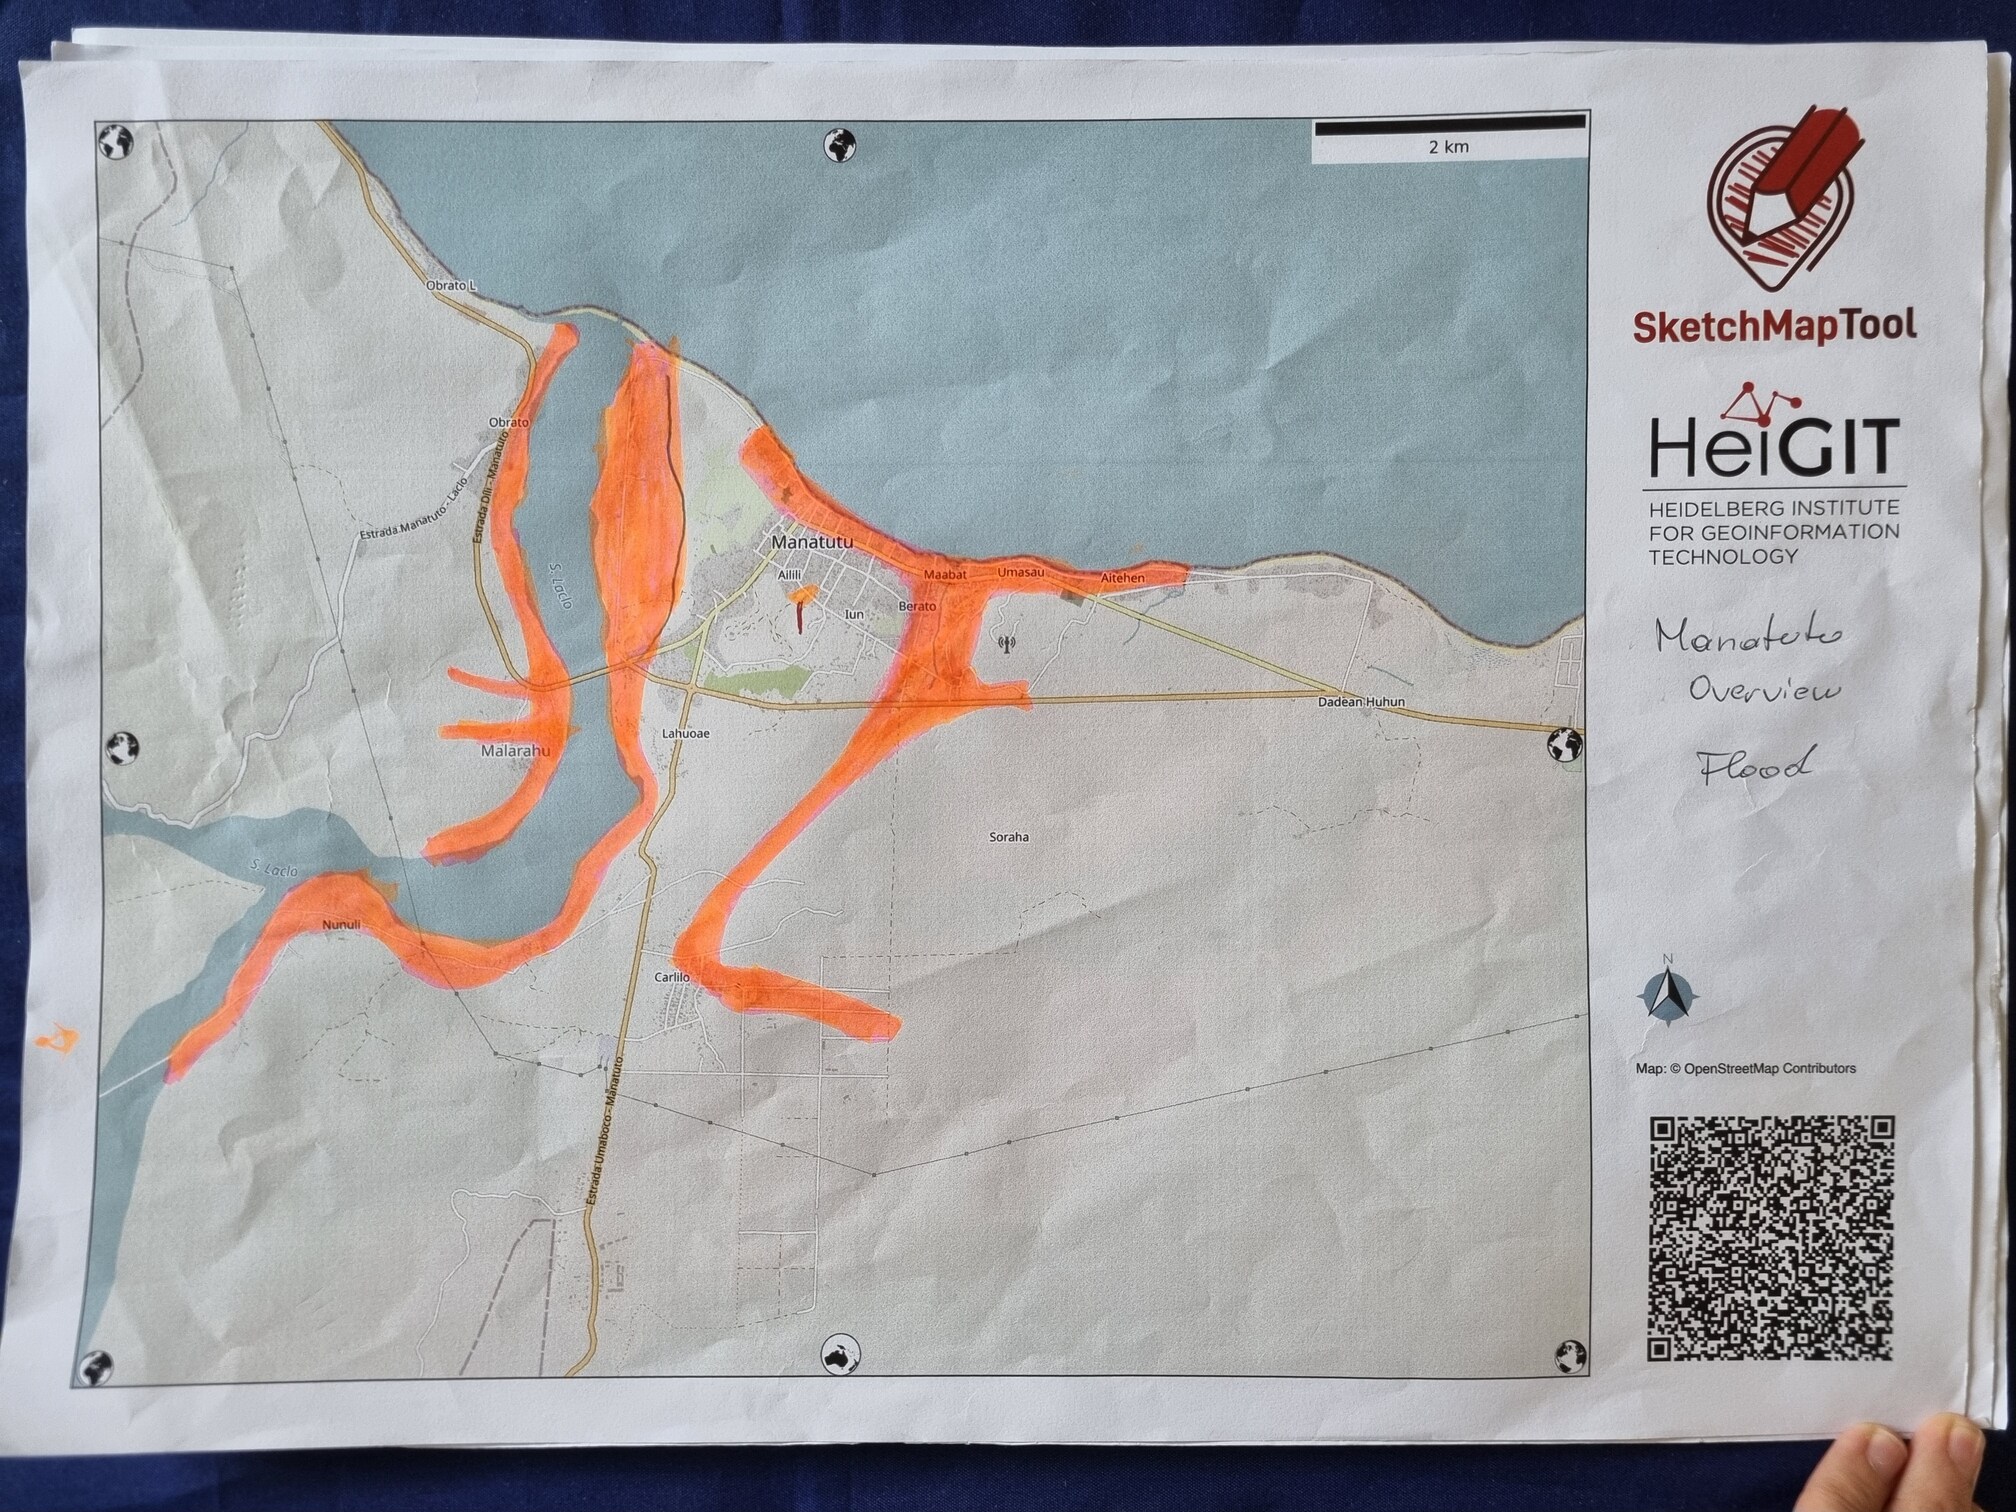
Das Sketch Map Tool wurde verwendet, um das Wissen der Gemeinschaft über die historischen Überschwemmungsausmaße, ihre Auswirkungen und vorhandene Kapazitäten zu erfassen.
Wie wurde das Sketch Mapping organisiert?
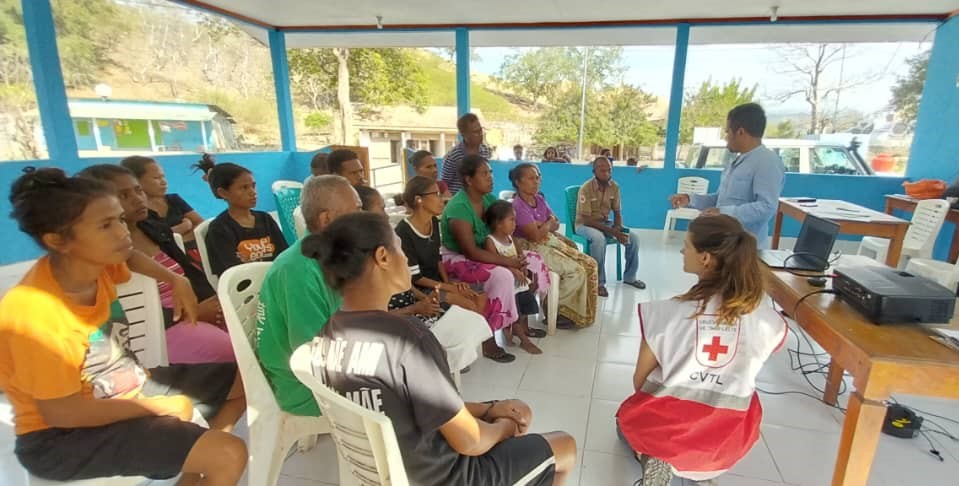
Vor Beginn der Kartierungsaktivität organisierte das Team Gemeindetreffen, um die Beteiligung der Bewohnenden während des gesamten Prozesses sicherzustellen. Die Einwohnenden der hochwassergefährdeten Dörfer wurden über das bereits bekannte Netzwerk des Roten Kreuzes von Osttimor und dessen lokale Zweigstellen kontaktiert. Gemeindevertretende aus jedem Dorf wurden zu diesen Treffen eingeladen und gebeten, Gemeindemitglieder mitzubringen, die von jüngsten Überschwemmungen betroffen waren. Bei der Auswahl dieser Mitglieder gab es keine Altersbeschränkungen und es wurde auf ein ausgewogenes Geschlechterverhältnis wert gelegt.
Diese Teilnehmenden kartierten das Ausmaß und die Lage historischer Hochwasserereignisse auf der einen Karte, während sie auf einer zweiten Karte die Kapazitäten wie Evakuierungsorte und natürliche Schutzgebiete identifizierten.

Wie wurden die Sketch Maps analysiert?
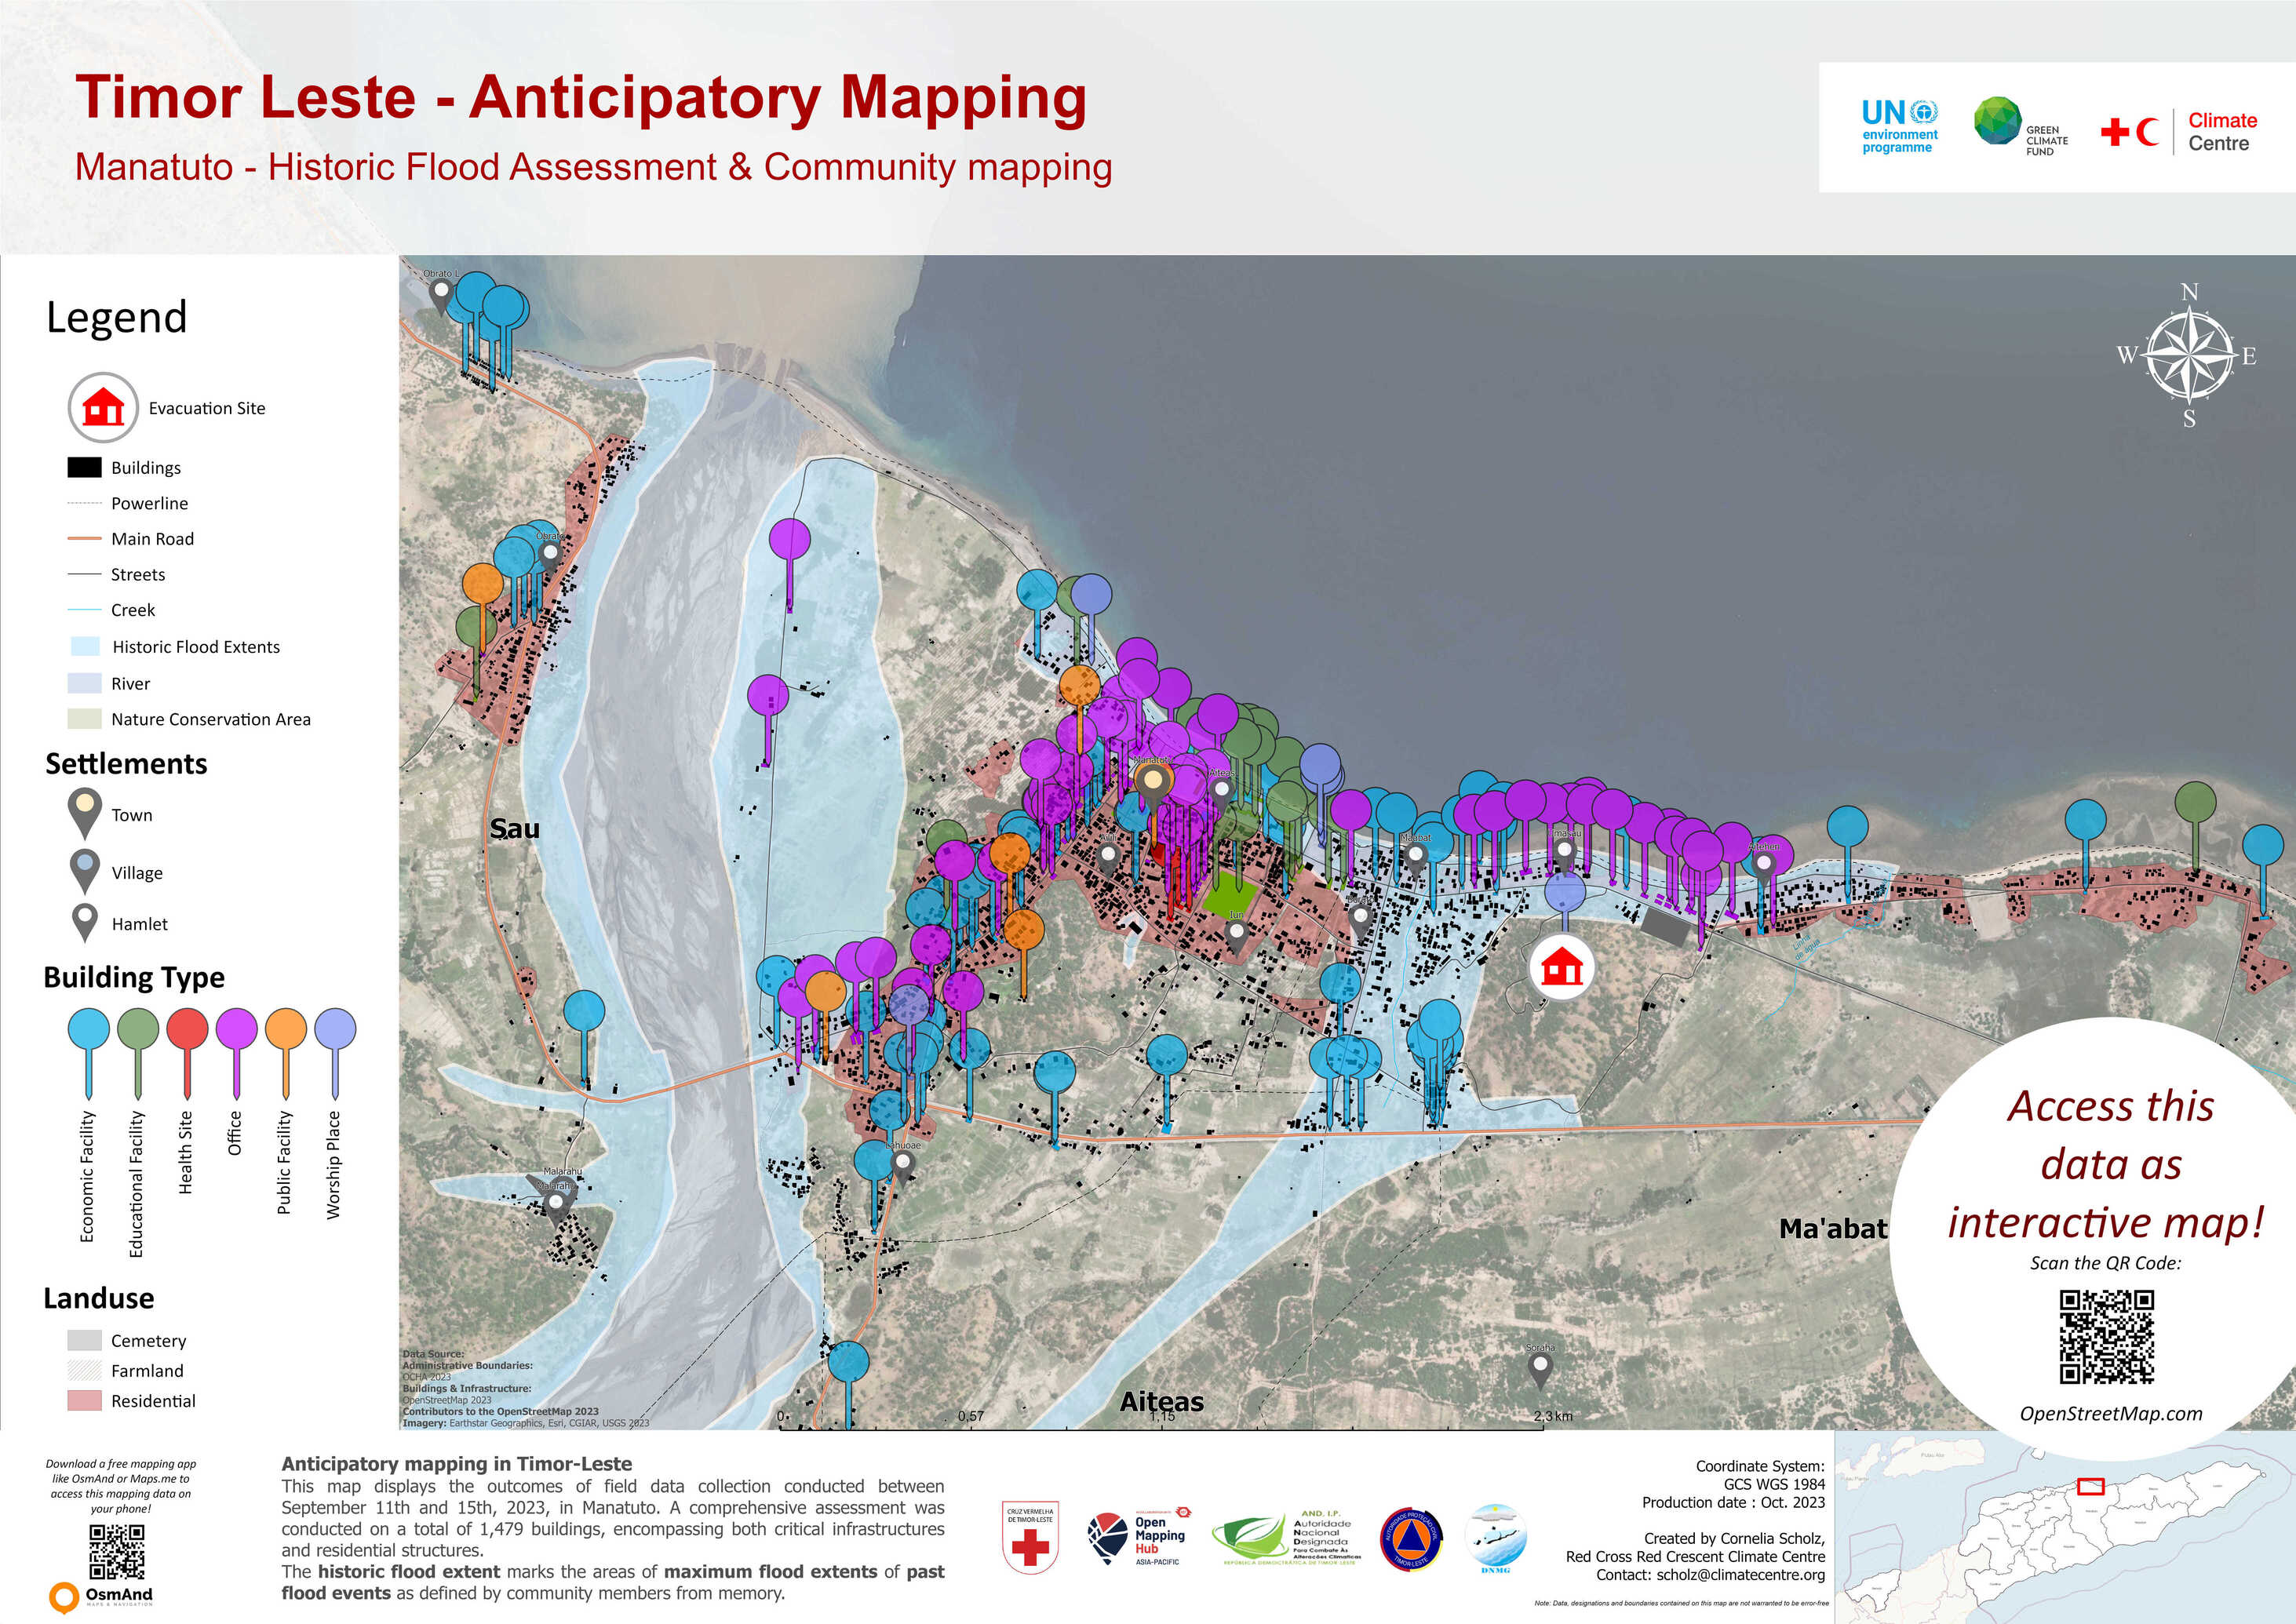
Die Kartierungen auf den Sketch Maps wurden mit anderen lokal erfassten Daten kombiniert und mithilfe von Geoinformationssoftware (in diesem Fall wurde ArcPro genutzt) in einer Gemeinschaftskarte visualisiert. Die Ergebnisse des gemeinschaftlichen Kartierens wurden auch zur Verbesserung von OSM-Daten verwendet, indem lokale Namen zu Flüssen und Dörfern hinzugefügt und Naturschutzgebiete direkt über den OSM-Editor eingezeichnet wurden.
Ergebnisse und Wirkung
Die gesammelten Informationen und erstellten Karten wurden genutzt, um lokale Gemeinschaften und Entscheidungstragenden bei der fundierten Entscheidungsfindung zu unterstützen und die Planung von vorausschauenden Maßnahmen (Anticipatory Action) zu erleichtern.

Gewonnene Erkenntnisse
- Eine Karte in großem Format (A3) ist handlicher zu nutzen als mehrere kleinere Karten mit detaillierter Darstellung bestimmter Gebiete.
- Die besten Ergebnisse wurden in kleineren Gruppen von 4 bis 6 Personen erzielt.
- Zusätzliche Satellitenbilder können die Orientierung auf den OSM-Basiskarten erleichtern.
- Der Digitalisierungsprozess hängt vom Zustand der Karte und der Qualität der aufgenommenen Fotos ab. Die Verwendung von Dokumentenmappen hilft dabei, die empfindlichen Papierkarten sauber und glatt zu halten und schützt sie während der Arbeit im Feld.
- Ein vorläufiges Kartieren mit denselben Markern/Stiften, die später verwendet werden, ist nützlich, um sicherstellen, dass alles wie geplant funktioniert.
