The Step-by-Step Instructions will guide you through the Sketch Map Tool and provide useful recommendations. You can also download and print the manual.
Answers to the Frequently Asked Questions can be found in the FAQ section below.
Here you can download the most important tips and questions for the mapping on one page.
Our training platform provides distinct training exercises to further explore the Sketch Map Tool and sketch mapping in general. These exercises are primarily designed for workshop settings, allowing for collaborative discussion of your experiences.
We are committed to continually enhancing the tool, so please report any technical problems to the Sketch Map Tool user support.
Instrucciones paso a paso
1
Crear mapas de papel para recolectar datos1.1 Define your area of interest and choose a base map
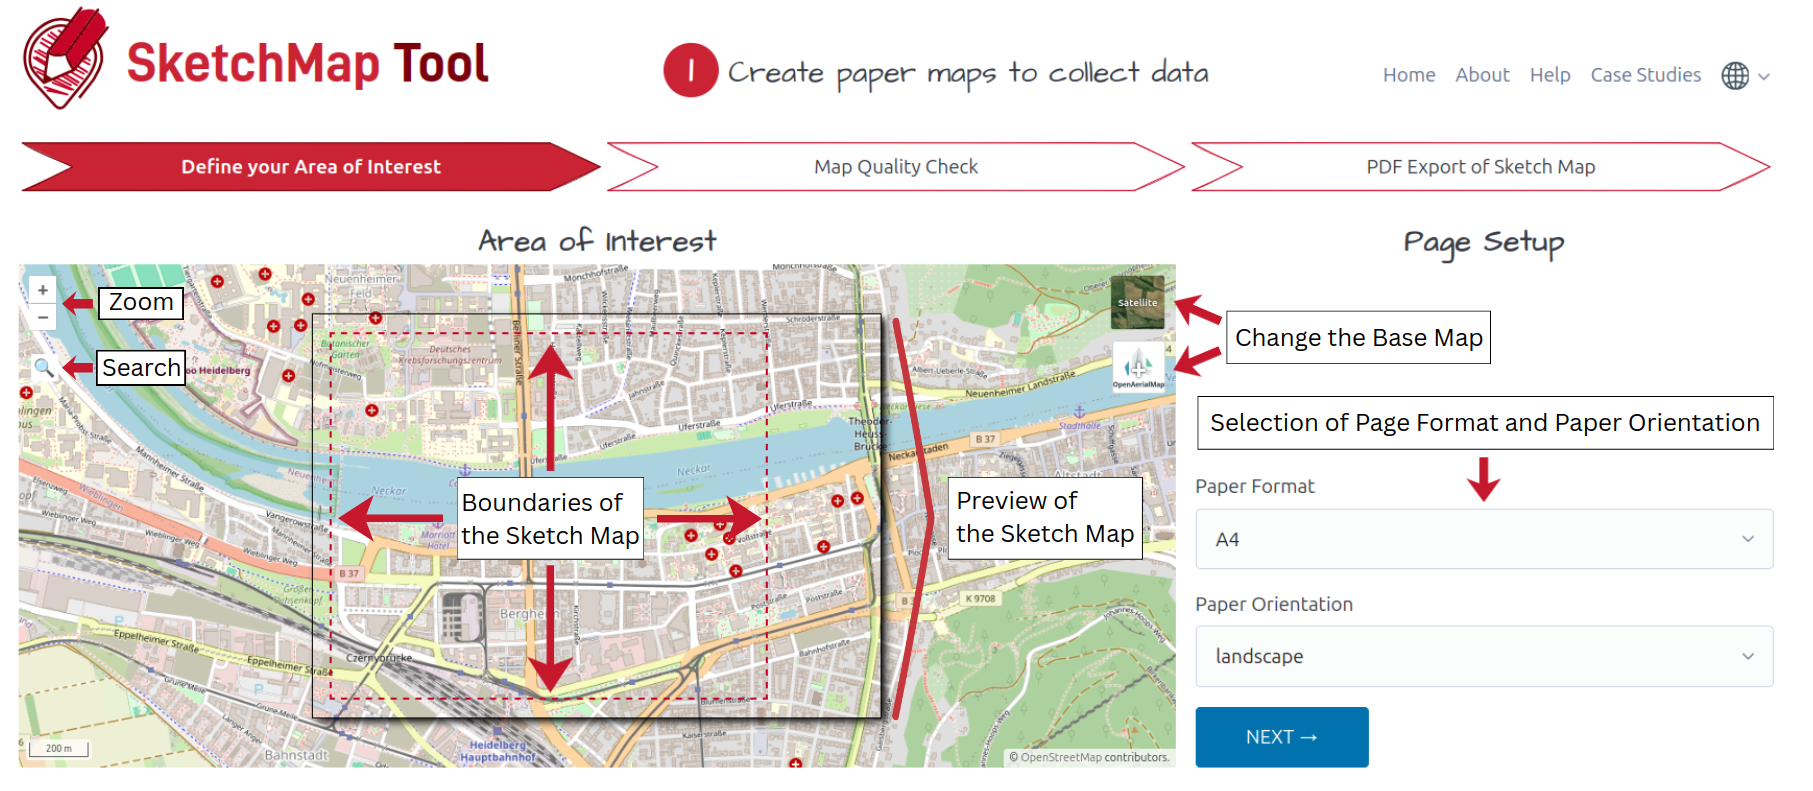
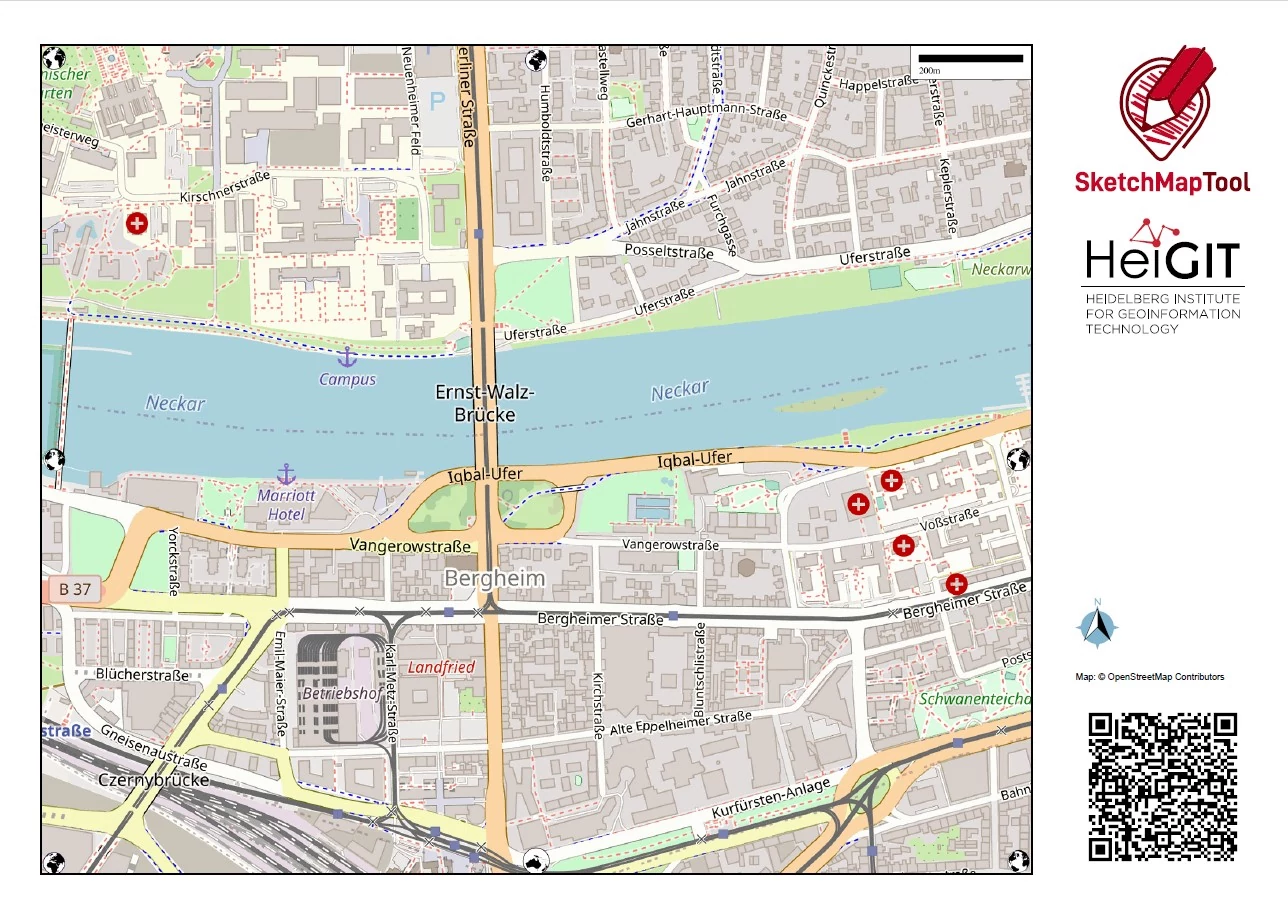
El primer paso para usar el Sketch Map Tool consiste en crear un Sketch Map imprimible.
Select your area of interest, either by zooming into the map preview or using the search
function in the sidebar. You can search for place names and coordinates.
Select from different paper formats and the appropriate page orientation. The dashed red line
represents the
boundaries of your area of interest, which will be printed on the Sketch Map.
Inicie la creación del mapa pulsando el botón azul "siguiente".
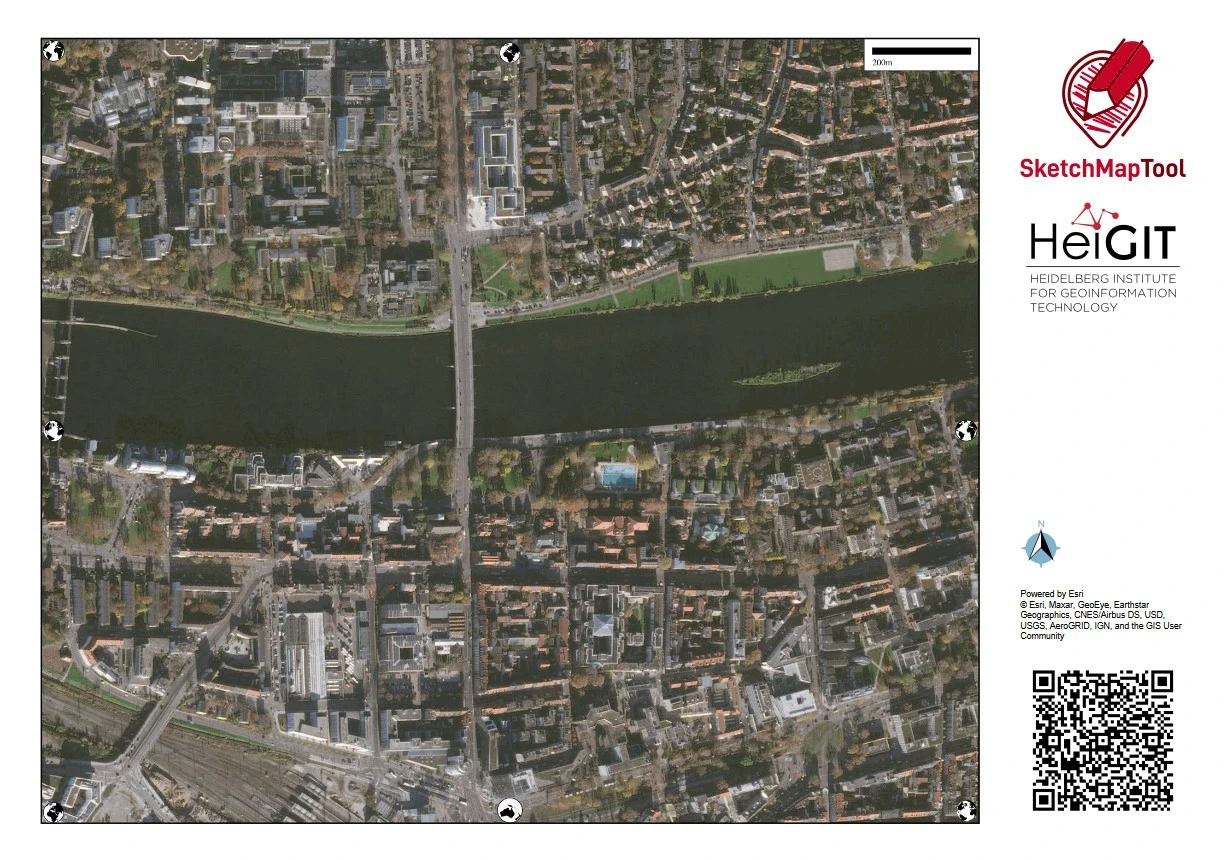
How to use a drone or satellite image from OpenAerialMap as base map
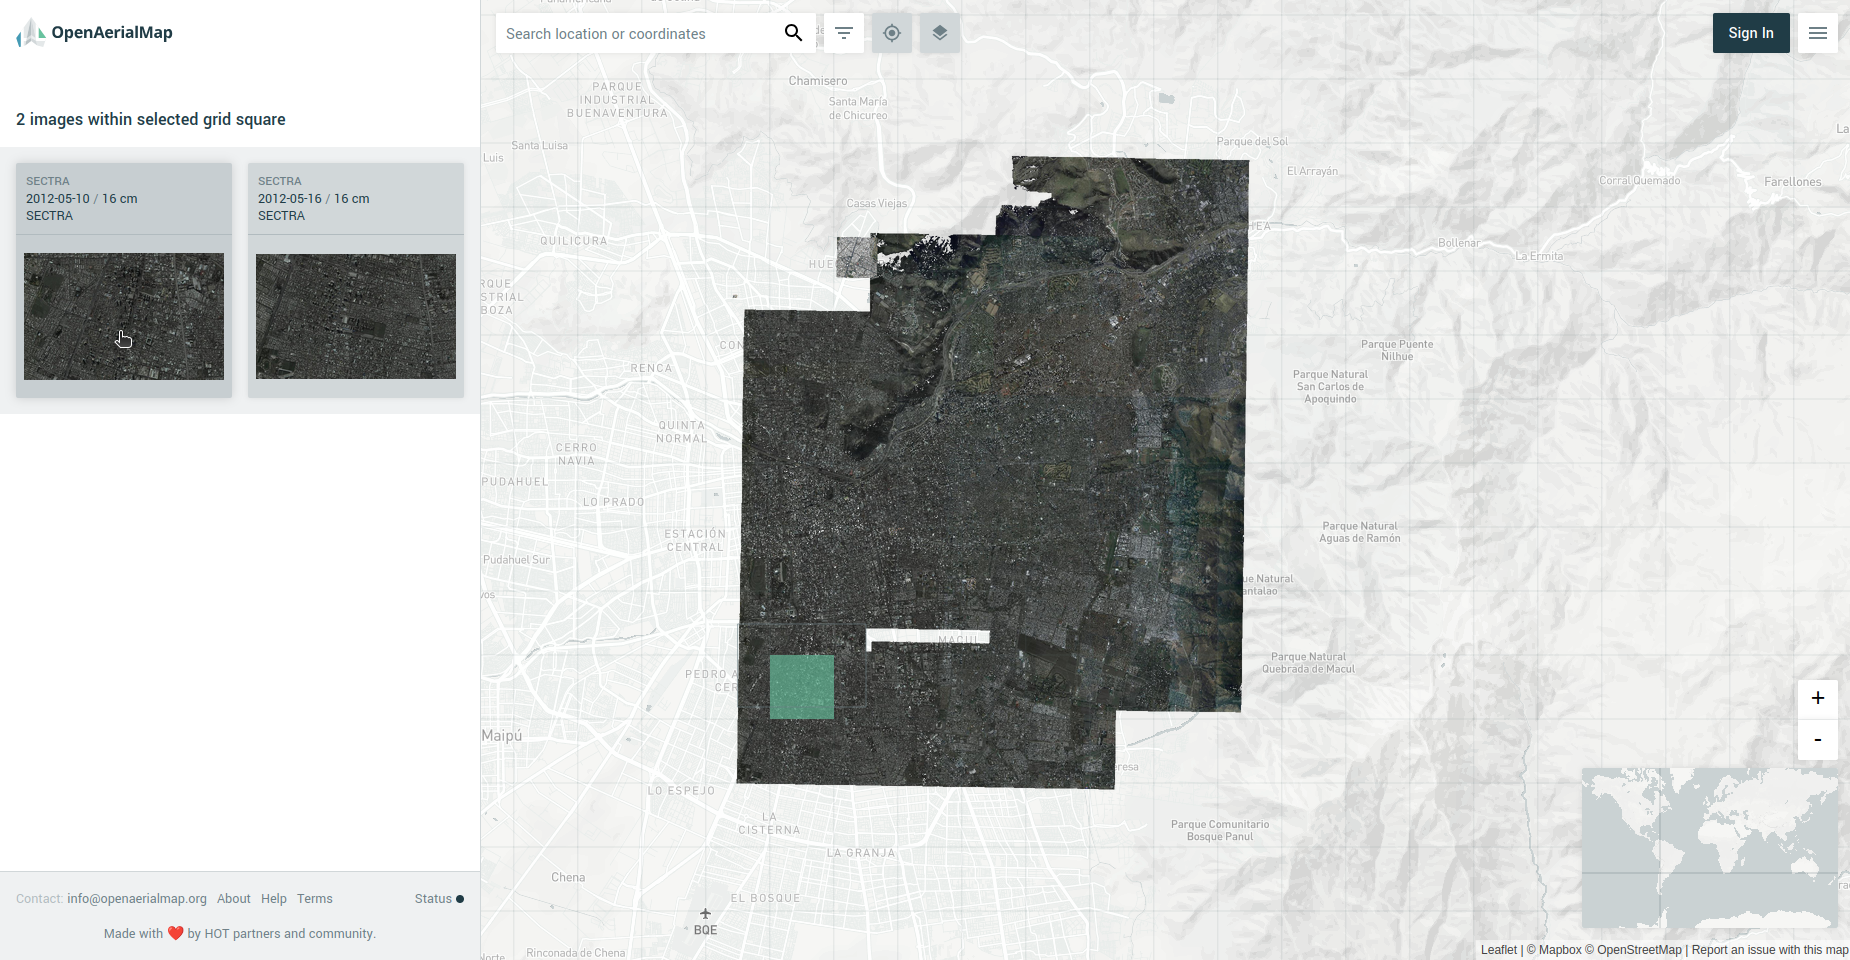
In case of choosing OpenAerialMap you will be redirected to their website in order to browse for your imagery. Choose an image by
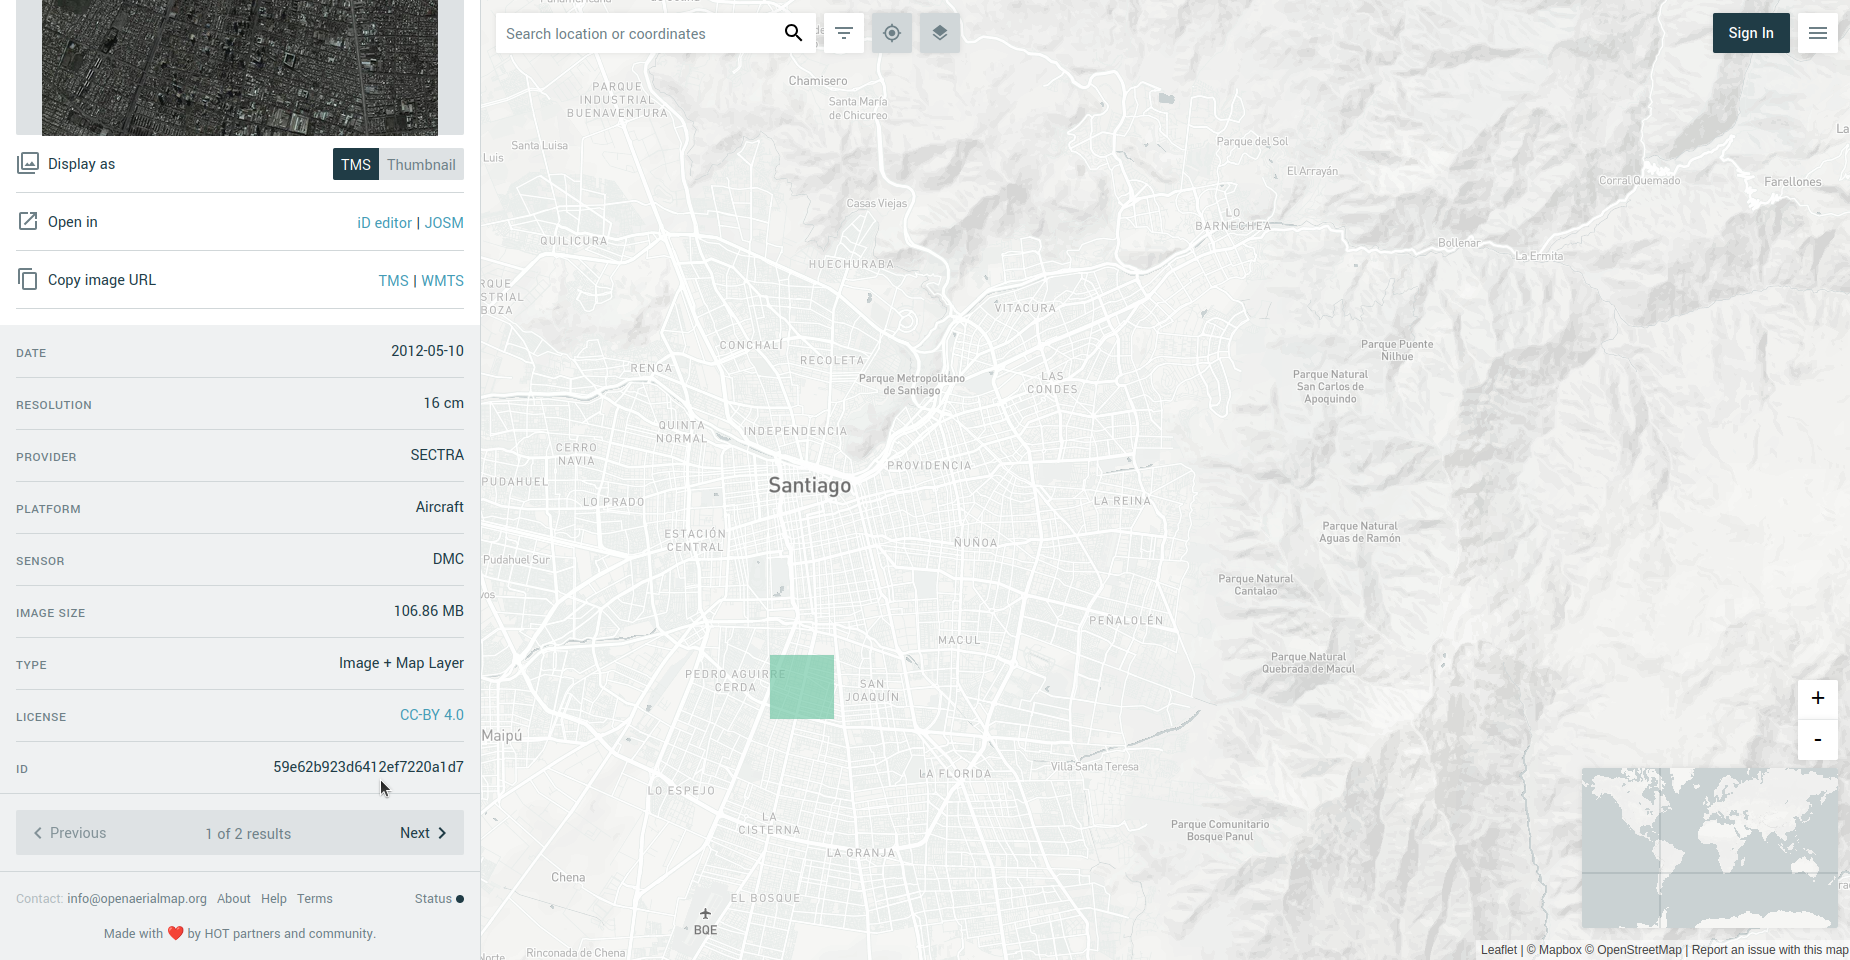
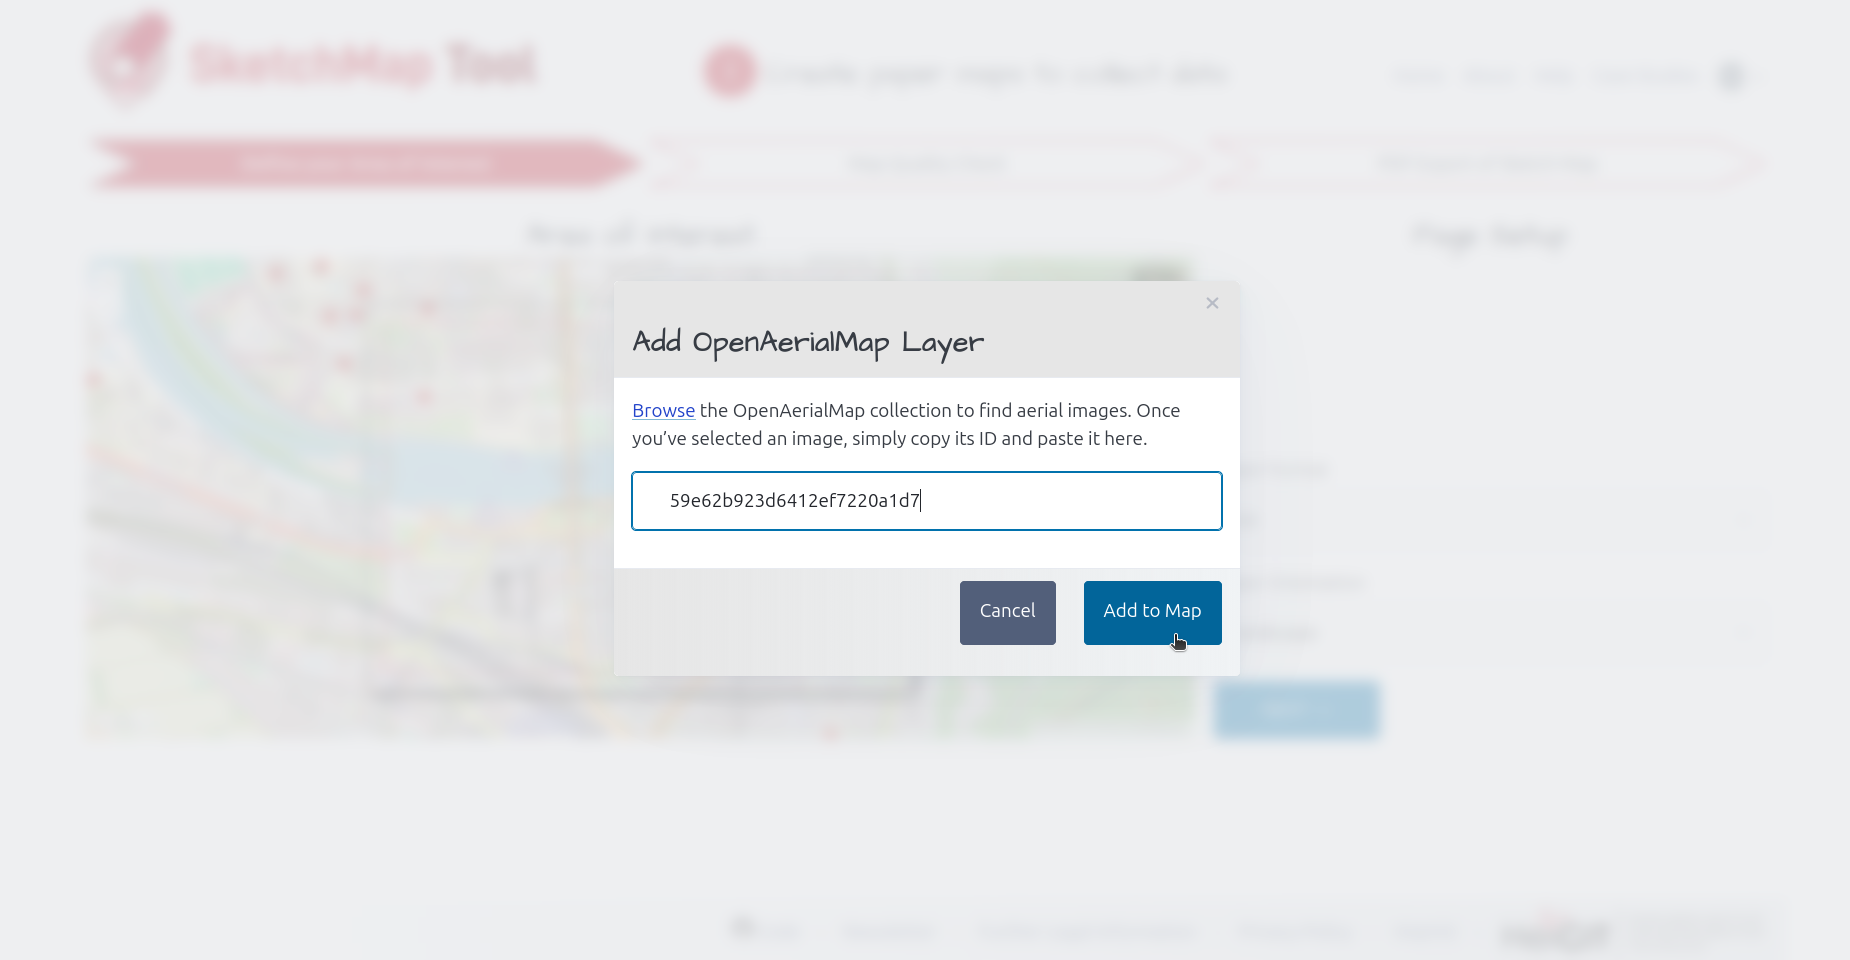
clicking on it on the left hand site and copying its ID and pasting it back to the Sketch Map Tool prompt. Please consider that OpenAerialMap does not yet have global coverage.
Therefore, it is necessary to check whether images are available for the area of interest.
If so, OAM can serve as an alternative to outdated or low-resolution ESRI satellite images.
Browse for your imagery
Click on a the imagery of your choice to retreieve the image ID
Paste image ID in Sketch Map Tool prompt
Tip: Consider creating several Sketch Maps of the same area with different base
layers if you are unsure which one will work best!
Choose the right paper format to fit your mapping needs:
El mapeo en grupo es más fácil si se imprimen mapas más grandes (A2 o A1, dependiendo del tamaño de tu grupo).
For data collection in the field, A4 or A3 are easier to handle.
Tip: If the area is too big, consider creating multiple Sketch Maps!
1.2 Exporta el Sketch Map como archivo PDF
El Sketch Map generado para el área de interés seleccionada puede descargarse como un archivo PDF haciendo clic en el botón azul.
Some recommendations:
Prepara mapas separados para cada tema o para personas/grupos porque es difícil leer y analizar muchas anotaciones en un solo mapa.
Puedes imprimir múltiples copias del mismo mapa.
Recomendamos imprimir los mapas en papel mate, no reflectante.
Name your maps appropriately; Putting names on the downloaded Sketch Maps can help
you in organizing your maps.
DESPUÉS: Collect data in the field
The printed Sketch Map is now ready to be used for your mapping activity. The way you draw on your map determines the detectability of your markings.
To help you in the field, we provide two handouts with best practices that you can print out:
The Sketch Map Tool detects shapes (point and polygons) and colors. To make sure your markings are detected:
Use contrast rich colors - red, blue, green, and black work great
Use thick and opaque pens (e.g. felt-tip markers)
Draw closed shapes with continuous lines (not dashed)
Please make sure to not draw over the black-and-white symbols on the map margin.
Tip: Test your pens and the detectibility of your markings before your mapping activity.
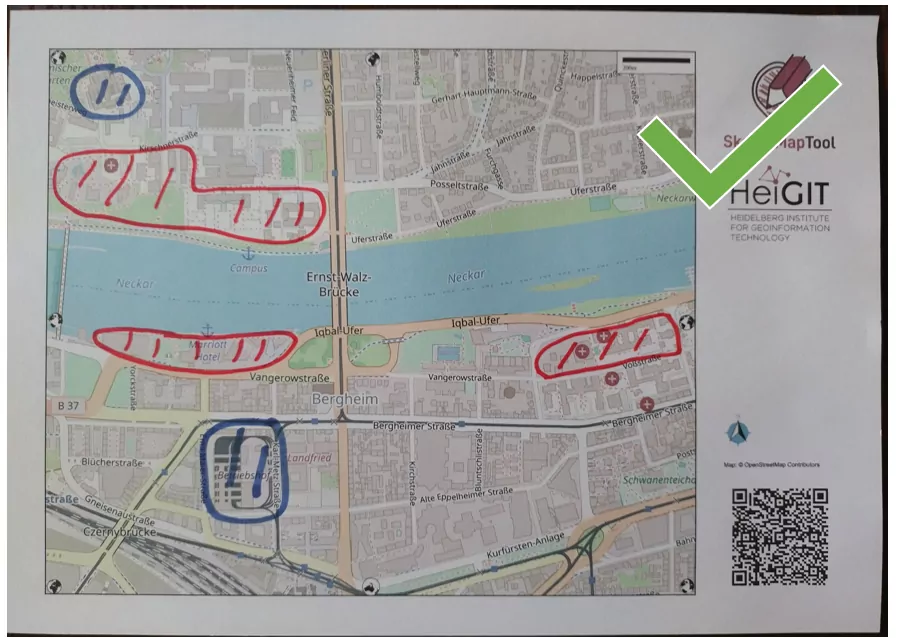
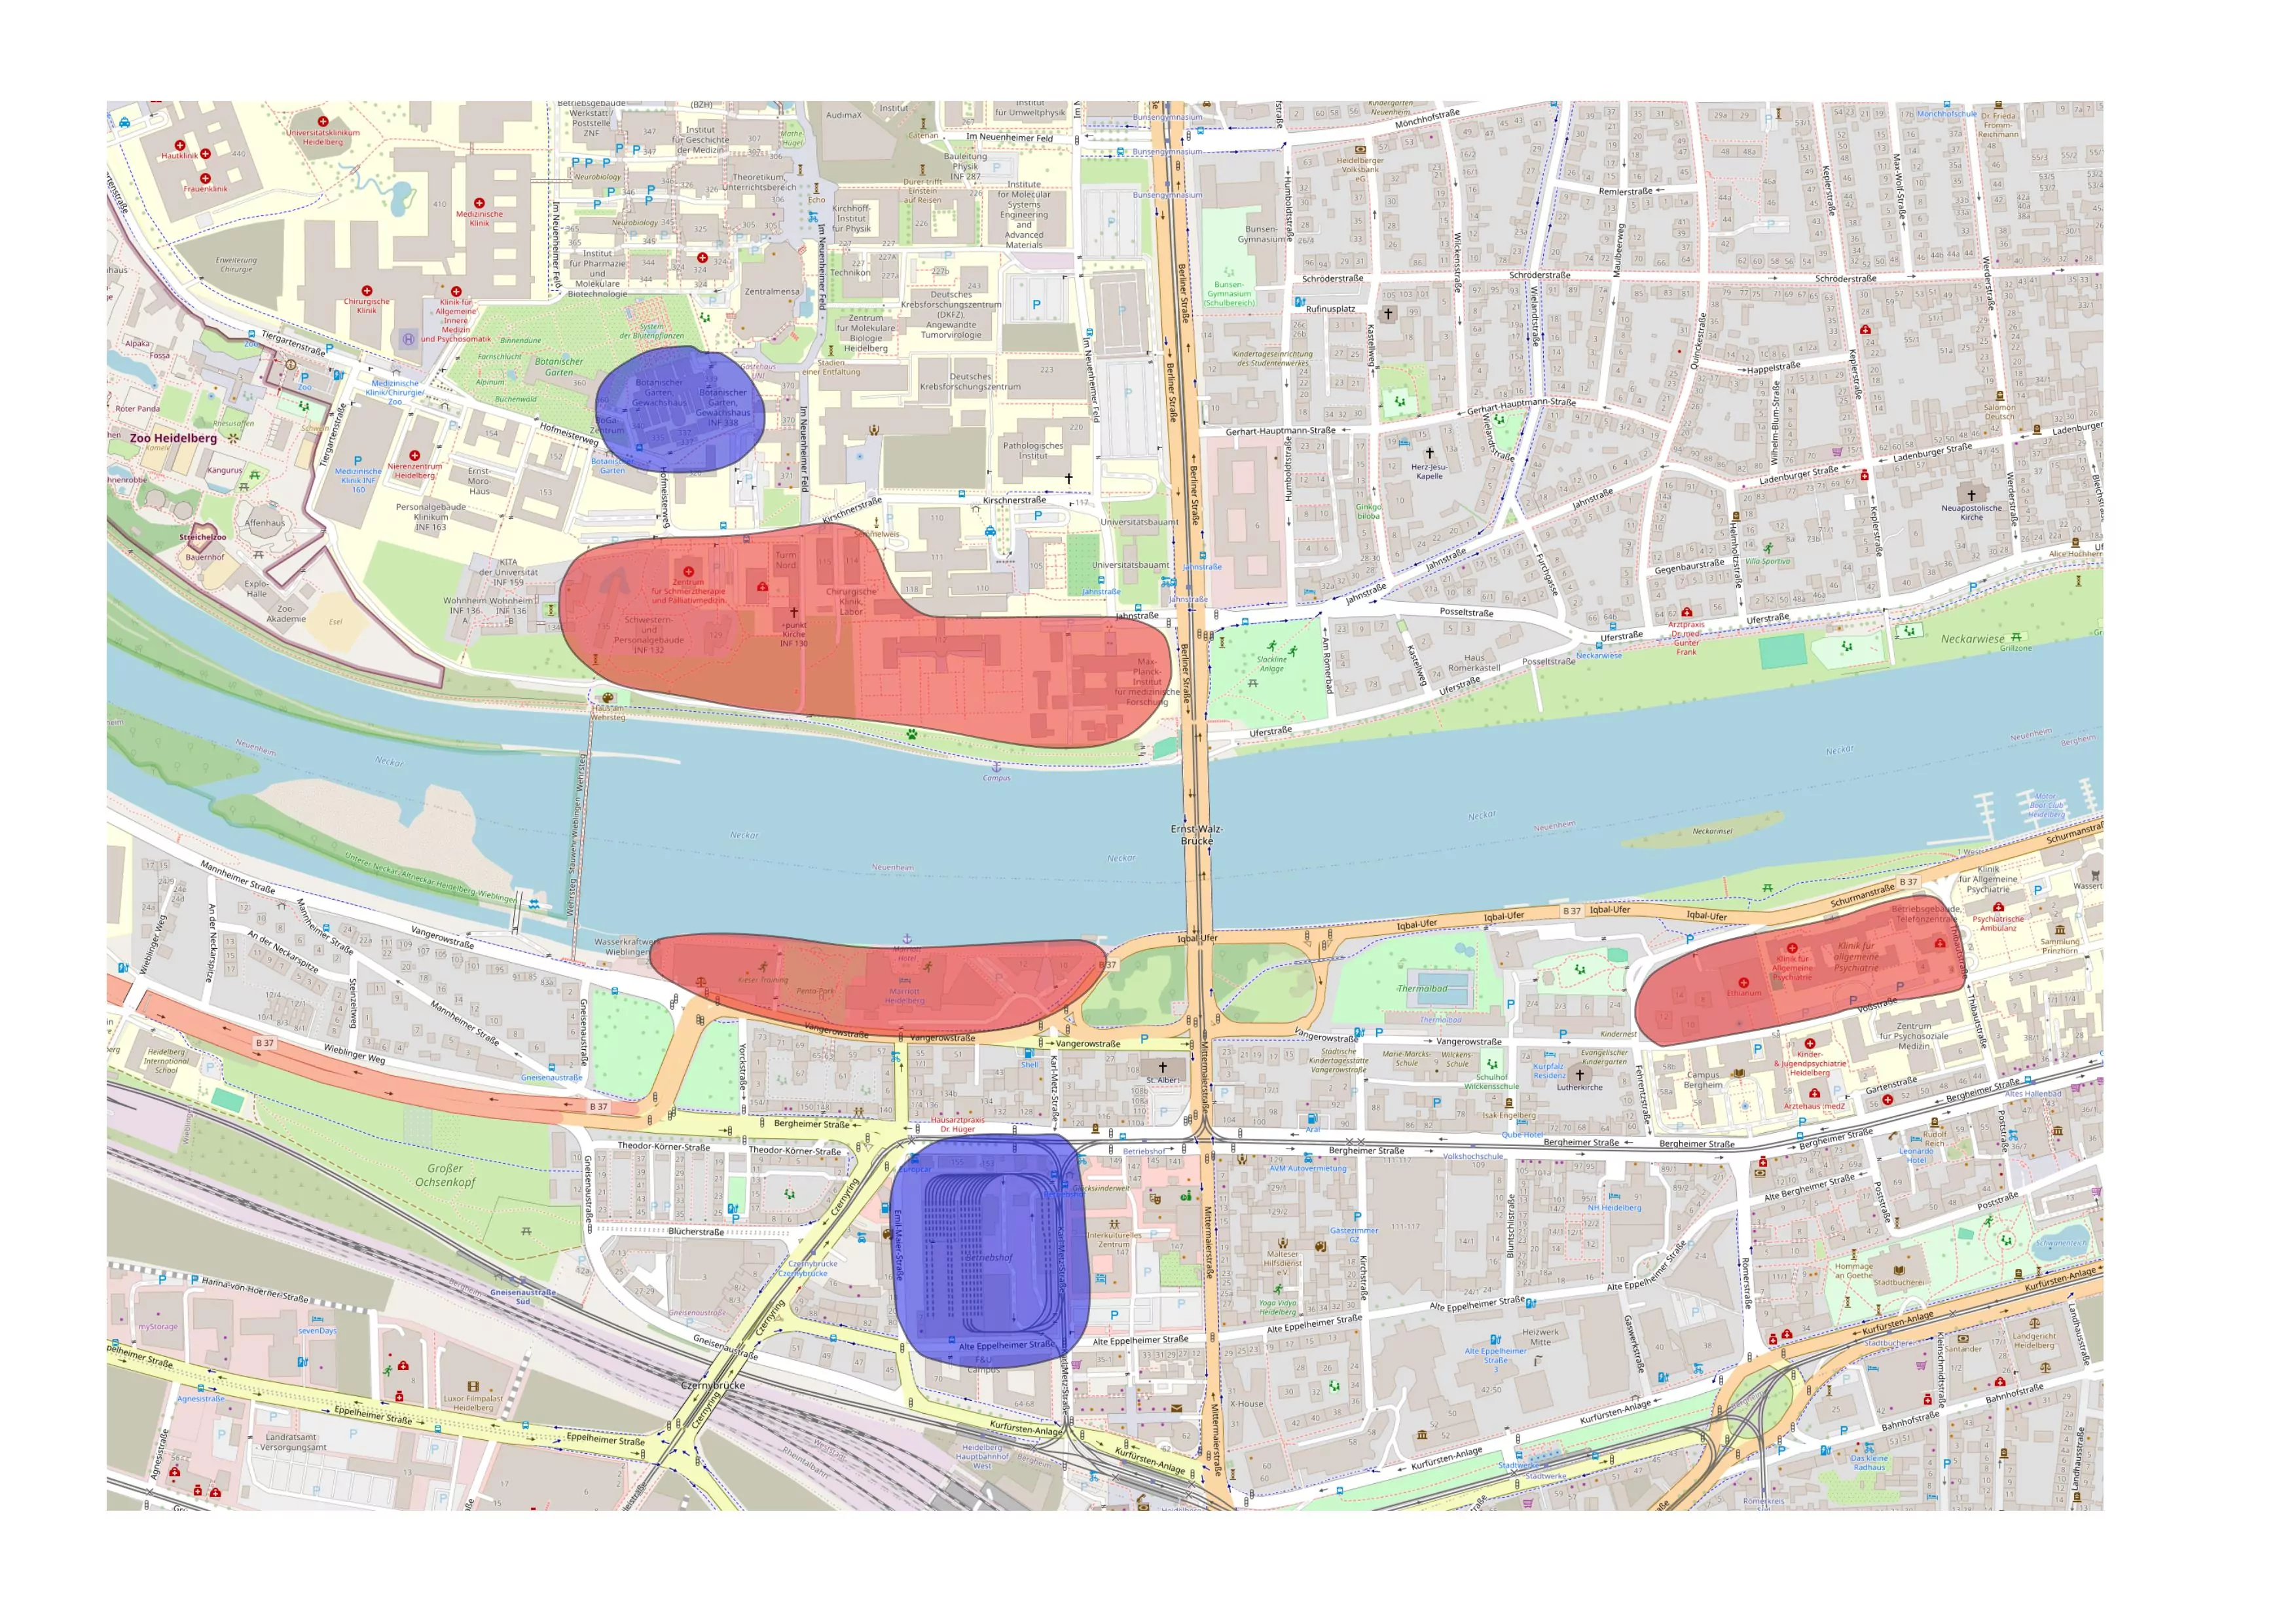
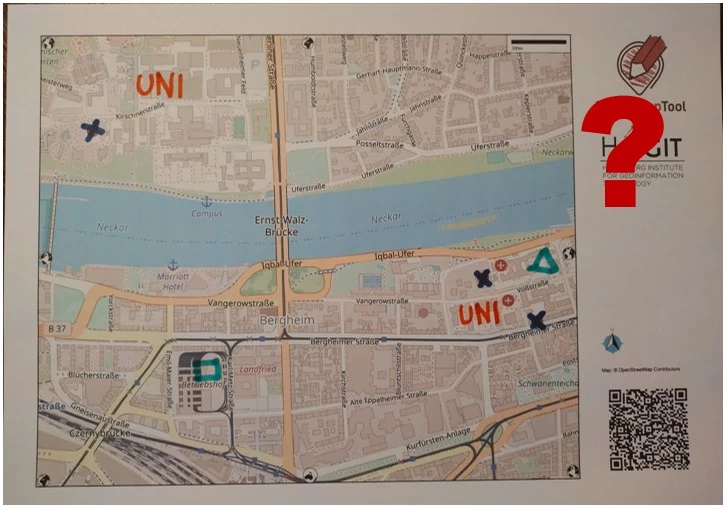
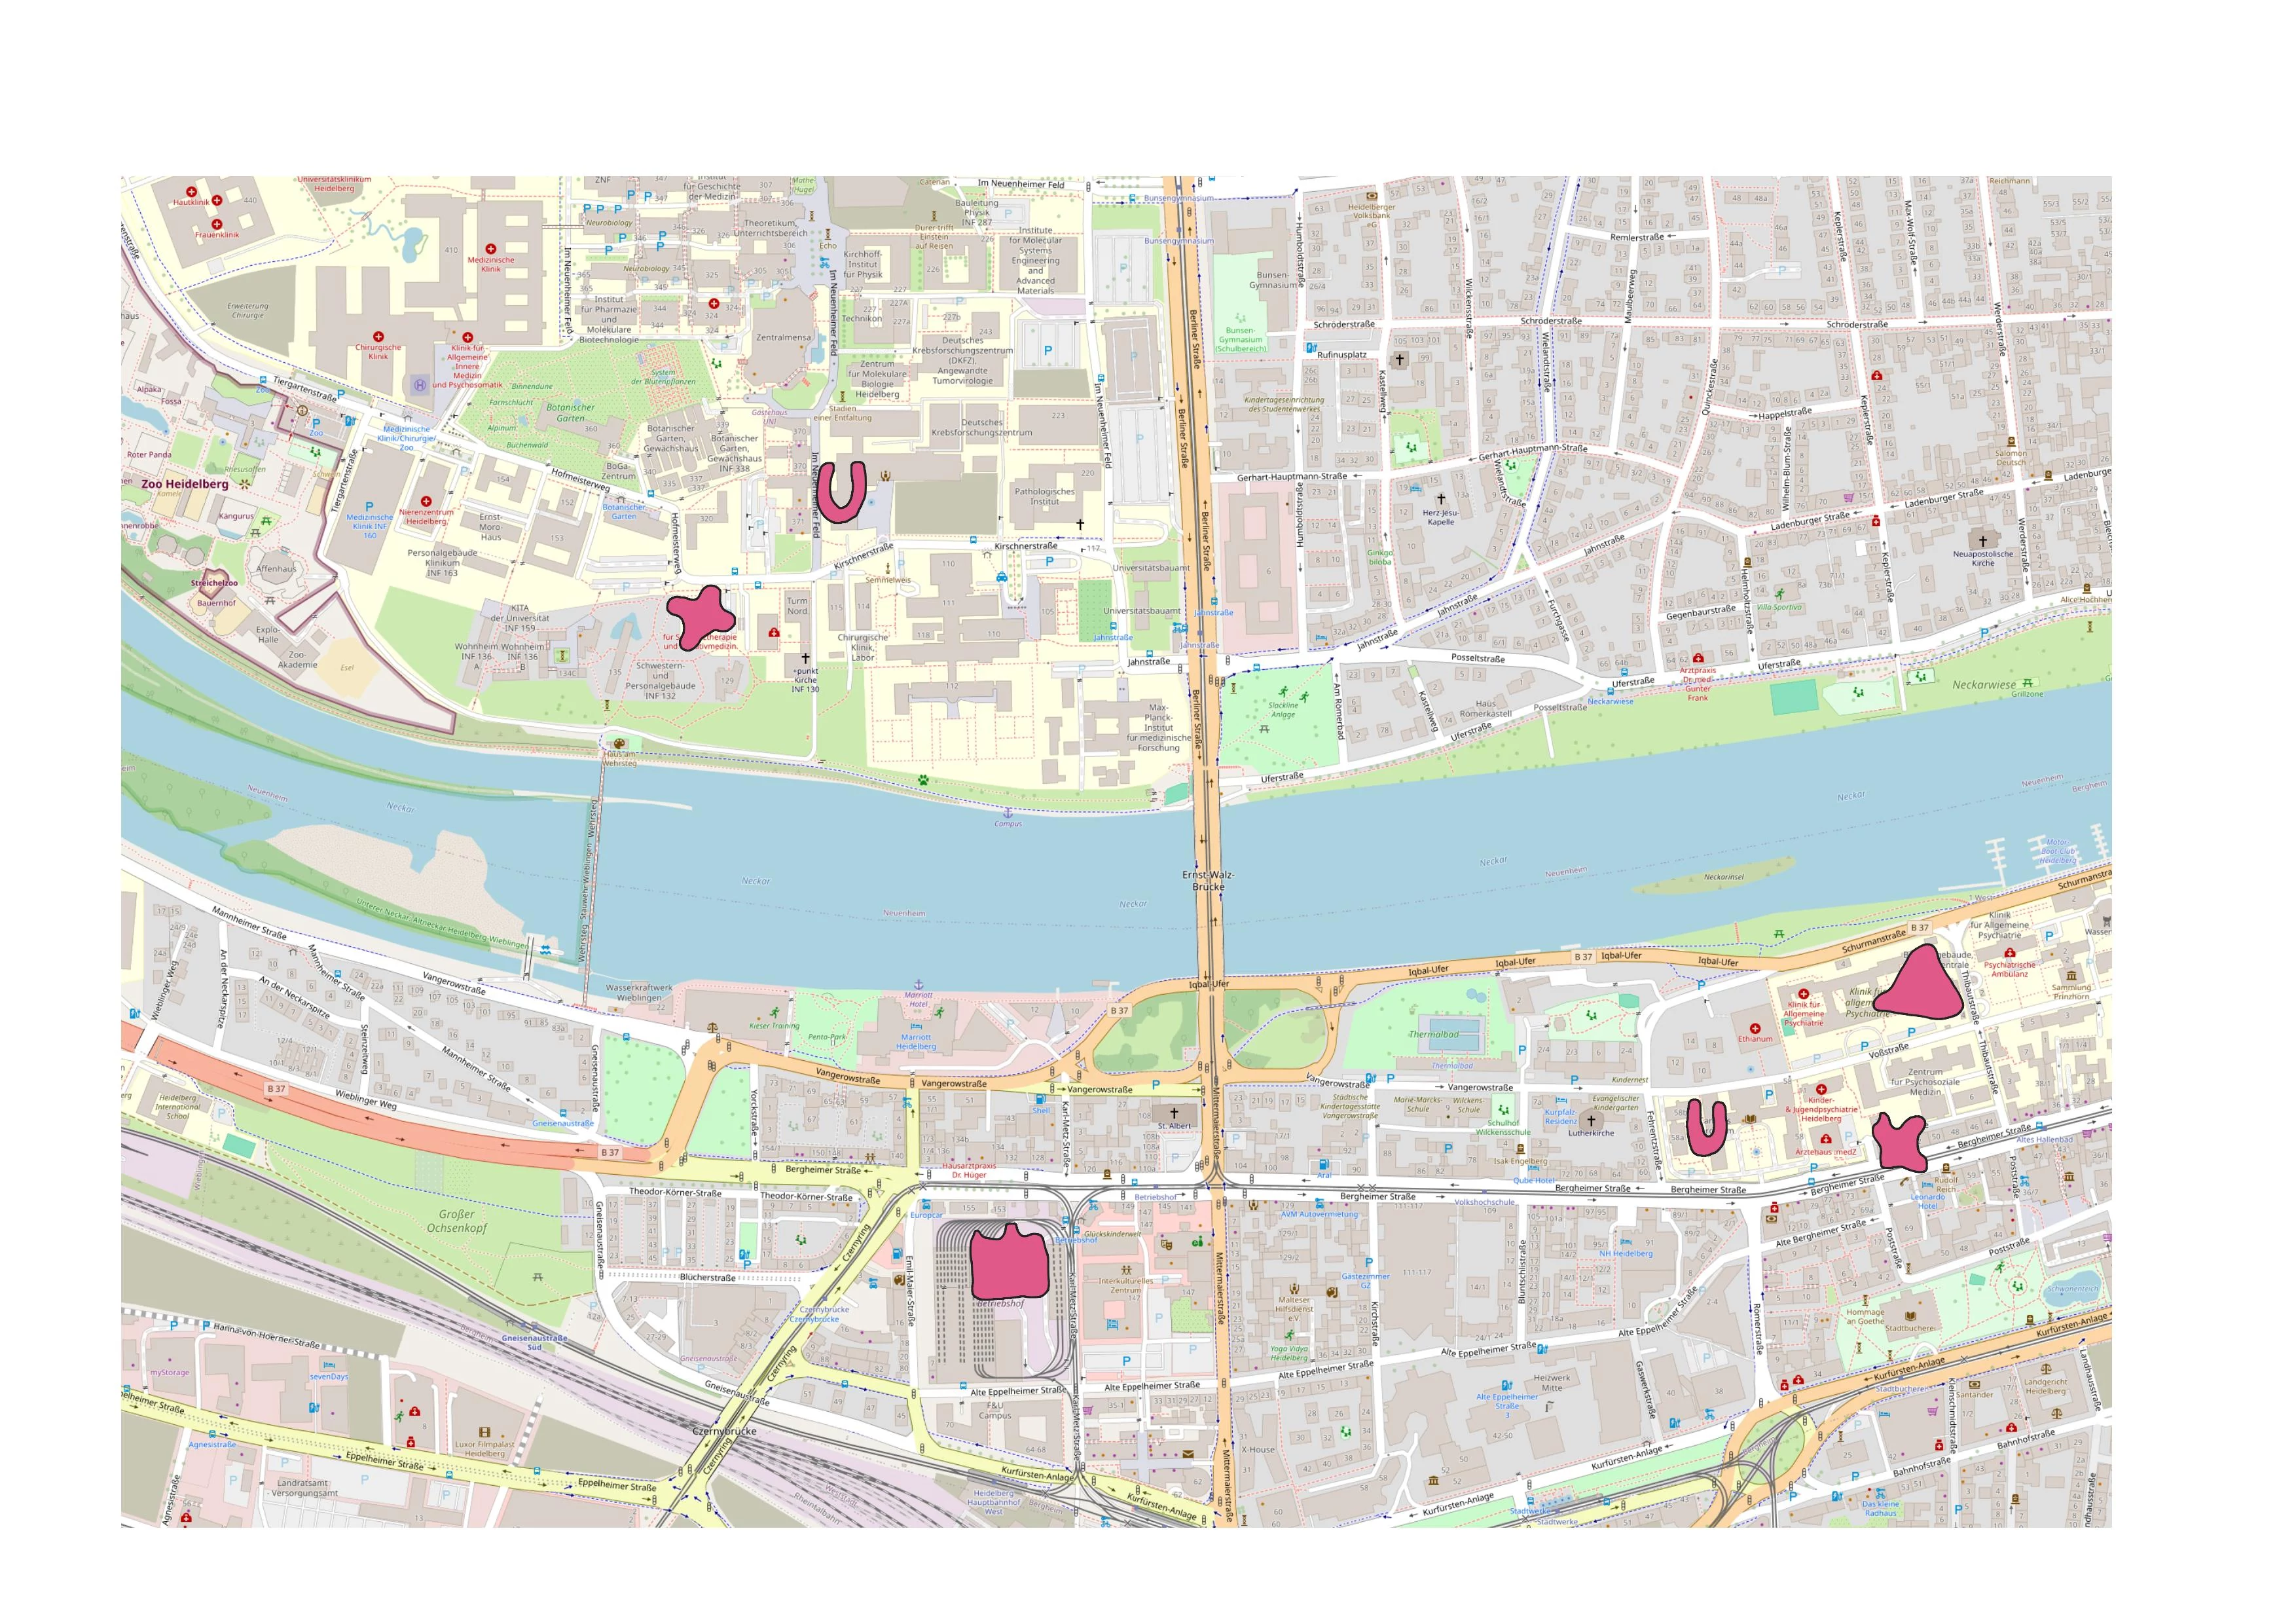
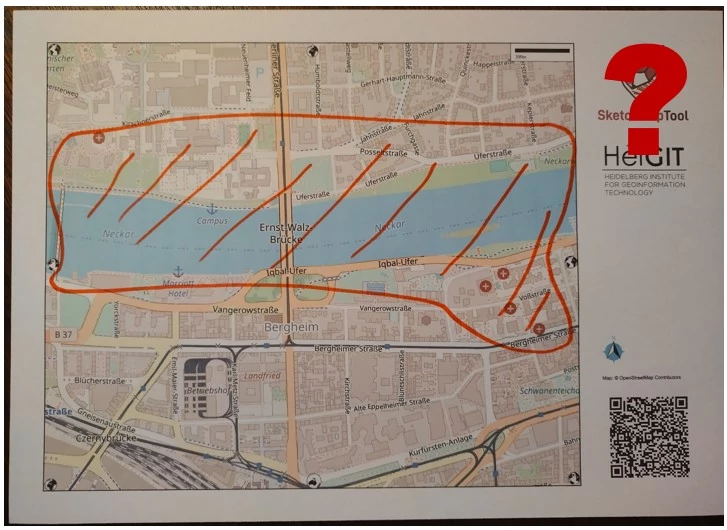
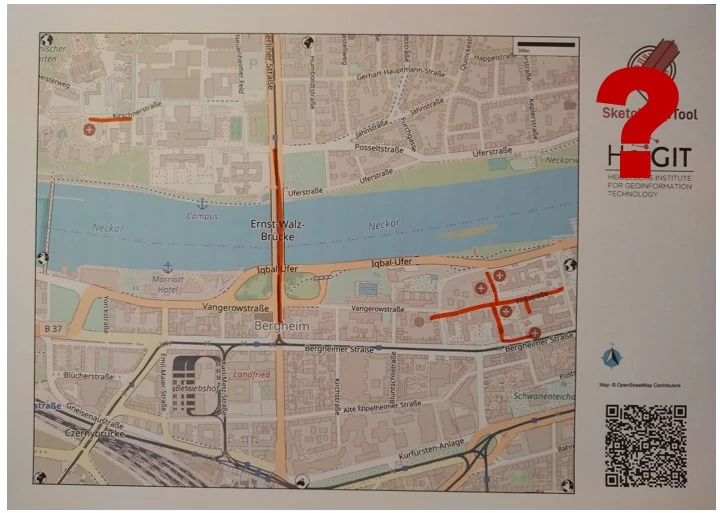
Original Image: Markings are thick, opaque and have good contrast.
Result: All shapes and colors were detected.
Click here for more examples
Original Image: Markings are thick, opaque and have good contrast.
Result: All shapes and colors were detected.
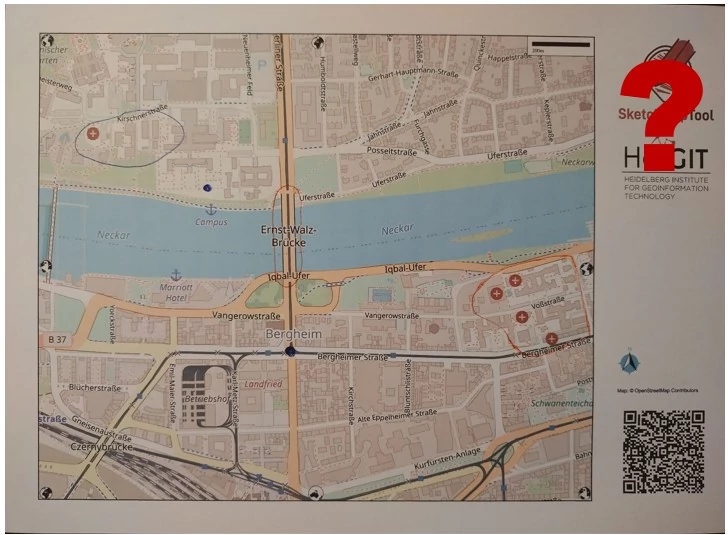
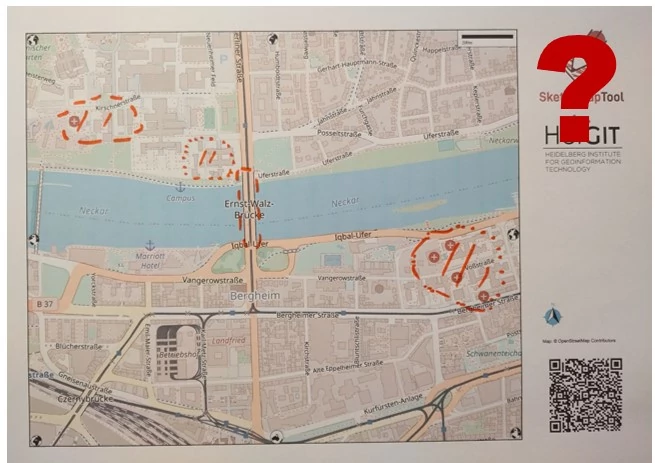
Imagen Original: marcada con formas diferentes.
Resultado: La forma de todo lo que escriba o dibuje en el mapa con un color que
la herramienta reconoce puede detectarse como un área marcada (polígono).
Sin embargo, en algunos casos, puede que no se detecten por completo.
Recommendations
Ancho de línea
Recomendada
Utiliza plumones gruesos de colores intensos.
No se recomienda
Es posible que no se detecten las líneas finas en colores claros. Generalmente recomendamos probar las plumas y la detectabilidad
de las marcas con el Sketch Map Tool antes de empezar a mapear.
Líneas de polígono
Recomendada
Para los polígonos, dibuje su contorno de forma cerrada, fuerte y continua.
No es necesario rellenar los polígonos, y el patrón que dibuje en el centro no se detectará.
Normalmente, los polígonos pequeños se detectan mejor que los grandes.
No se recomienda
Los vacíos en el contorno podrían producir errores en la detección.
Large polygons might not be detected properly. If you need to draw large polygons, please consider to zoom out.
Si sólo dibujas una línea, se detectará la zona marcada por la línea.
Sin embargo, no recomendamos usar líneas, dado que el modelo no ha sido entrenado para detectar las líneas
y hacerlo podría llevar a errores en la detección de marcas.
Si quieres dibujar un punto, dibuja un círculo más grande para mejorar la detección.
Si desea dibujar líneas, dibuje líneas fuertes, no discontinuas y con colores intensos.
Sugerencia: Si necesitas el marcado como una línea o un punto, puedes transferirla manualmente o digitalizarla tu mismo, por ejemplo, en QGIS (tutorial Ejercicio de formación 4)
Mapas base satelitales
Recomendada
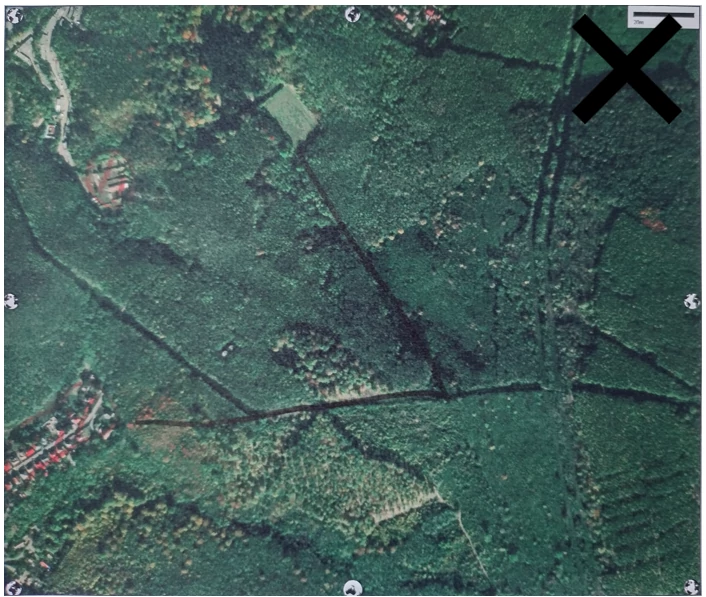
Compruebe la oscuridad del mapa base satelital, especialmente antes de imprimirlo en blanco y negro.
Asegúrate de usar colores vivos y marcar los mapas de manera clara. A veces
puede ser útil utilizar ambos Sketch Maps con imágenes satelitales
y mapas base OSM para el mapeo.
No se recomienda
Los polígonos pequeños pueden ser especialmente difíciles de detectar.
2
Del papel al GIS: Digitaliza automáticamente los datos recolectados2.1 Photograph your marked
Sketch Maps
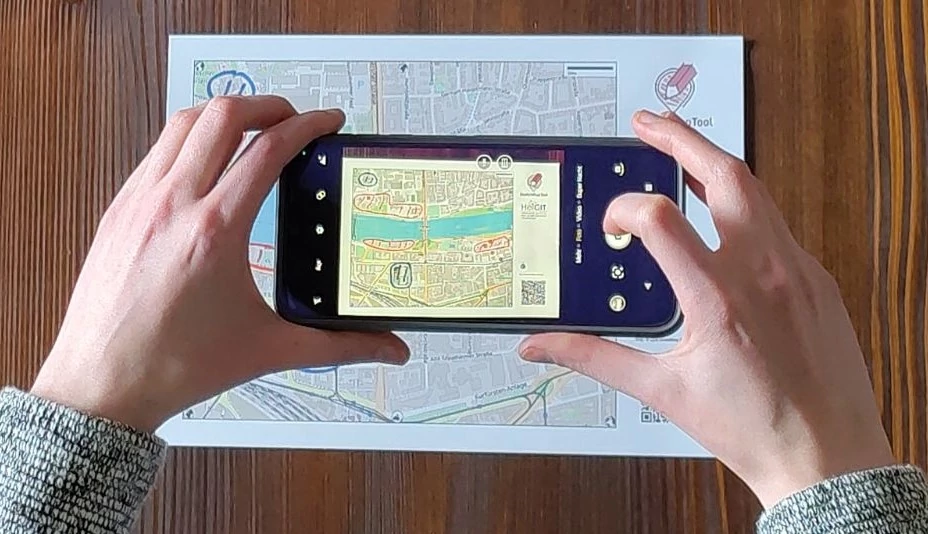
Take a photo of you Sketch Map.
Make sure that all map elements (QR code and entire map) are visible
Take the photo from above at a 180 degree angle (not tilted)
Ensure good lighting conditions (no shades)
Tip: If you experience problems take new photo. Small changes in lightning and angle can make a difference!2.2 Sube tus Sketch Maps
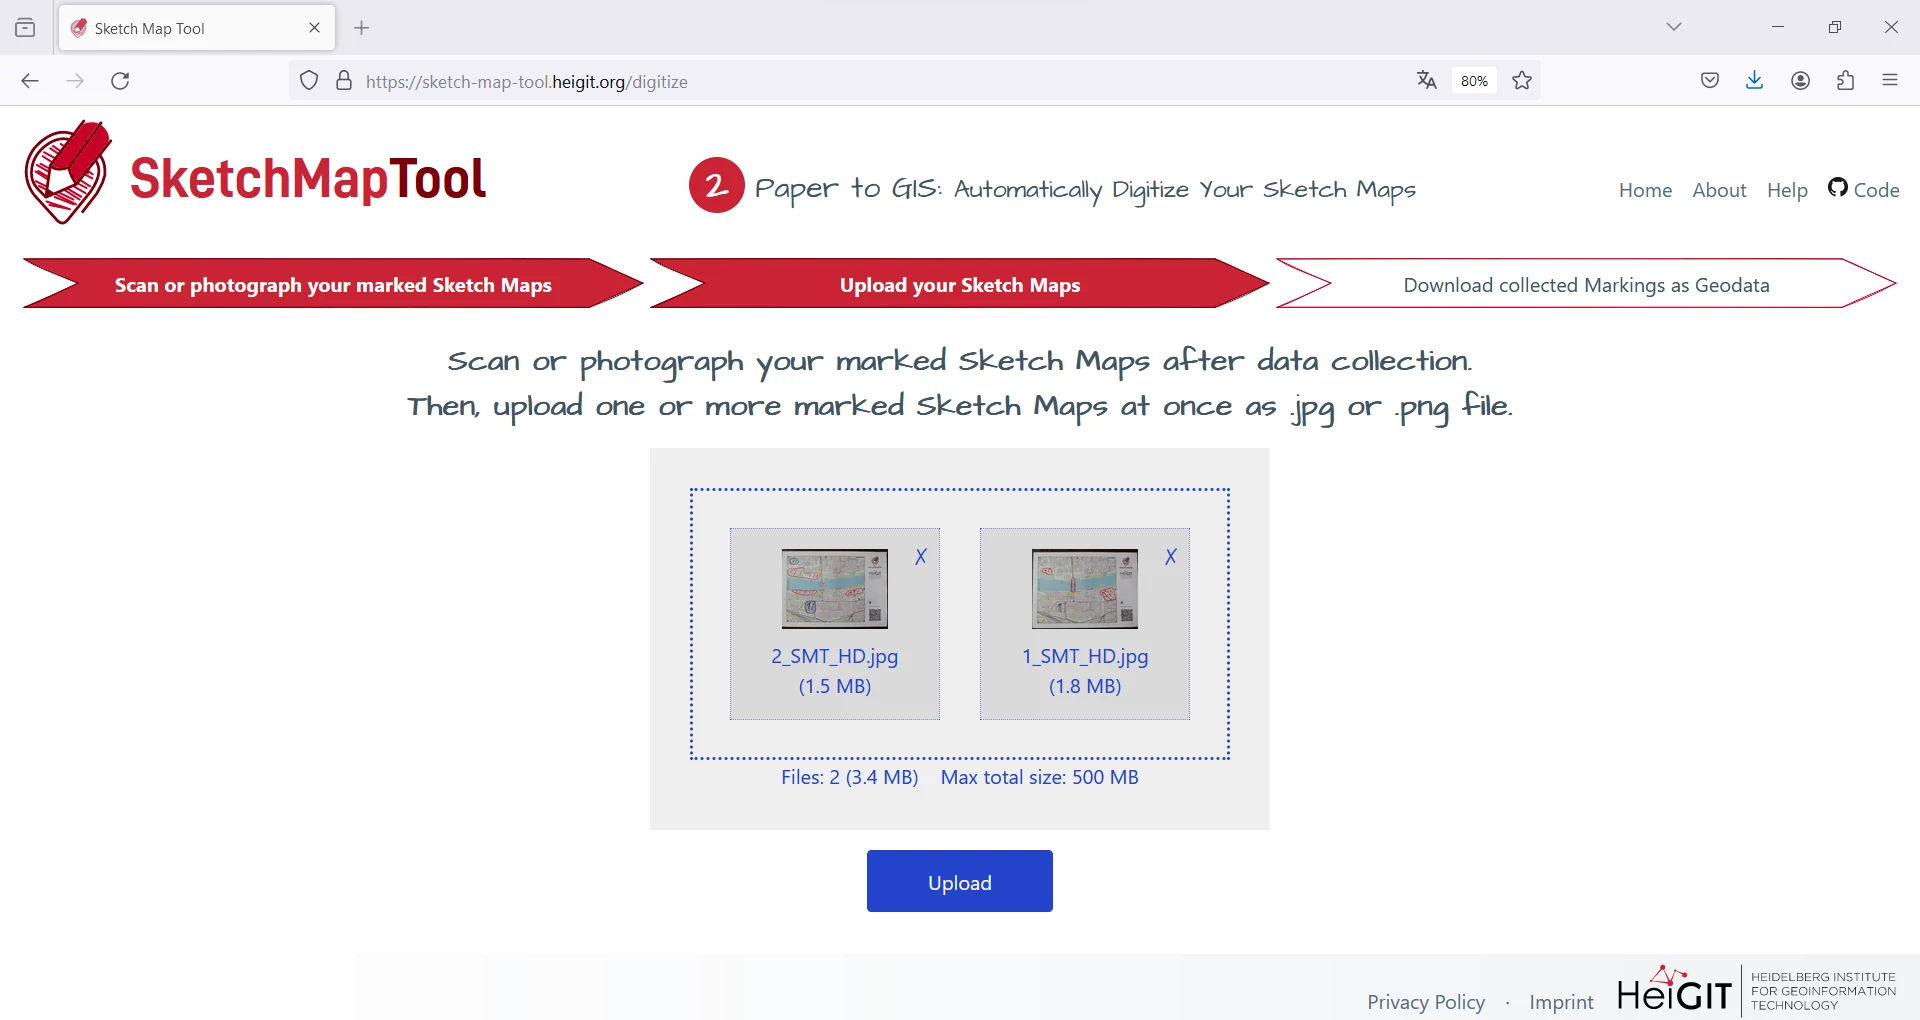
Use the upload dialog to upload your Sketch Map(s).
Note: Until your result is ready it can take up to 2 minutes per Sketch Map.
2.3 Descargar las marcas detectadas como geodatos
Finally, you can download the detected markings of all your Sketch Map(s) as vectors in one GeoJSON. Additionally, the georeferenced Sketch Maps are made available as a GeoTIFFs.
FINALMENTE:
From Map to Action
Showing all the markings from your Sketch Maps on one map helps you see patterns, discuss them with others, and turn local knowledge into concrete action.
You need a Geographic Information System (GIS) to open your digitized markings. There are several open-source and free GIS tools:
Conservación de datos funcionalmente necesaria: Necesitamos el marco cartográfico original para digitalizar tu Sketch Map.
Los marcos cartográficos de los mapas creados se almacenan durante 12 meses, dándole la oportunidad de digitalizar su Sketch Map en esos 12 meses.
Del papel al SIG
Conservación de datos funcionalmente necesaria: Las imágenes cargadas de Sketch Maps se almacenan para su
procesamiento (georreferenciación y detección de marcas) hasta que se generan los resultados.
Los resultados se almacenan y están disponibles para su descarga durante un periodo de 24 horas, tras el cual se eliminan.
Comparte tus datos para mejorar el Sketch Map Tool
De forma voluntaria, puede permitirnos conservar tus Sketch Maps guardados más allá de su procesamiento para seguir mejorando el Sketch Map Tool.
Si optas por marcar la casilla de verificación, nos permites ...
conservar los Sketch Maps que haya cargado para futuras mejoras de la herramienta, como el entrenamiento de
nuestros modelos de aprendizaje automático que detectan sus marcas en las imágenes cargadas.
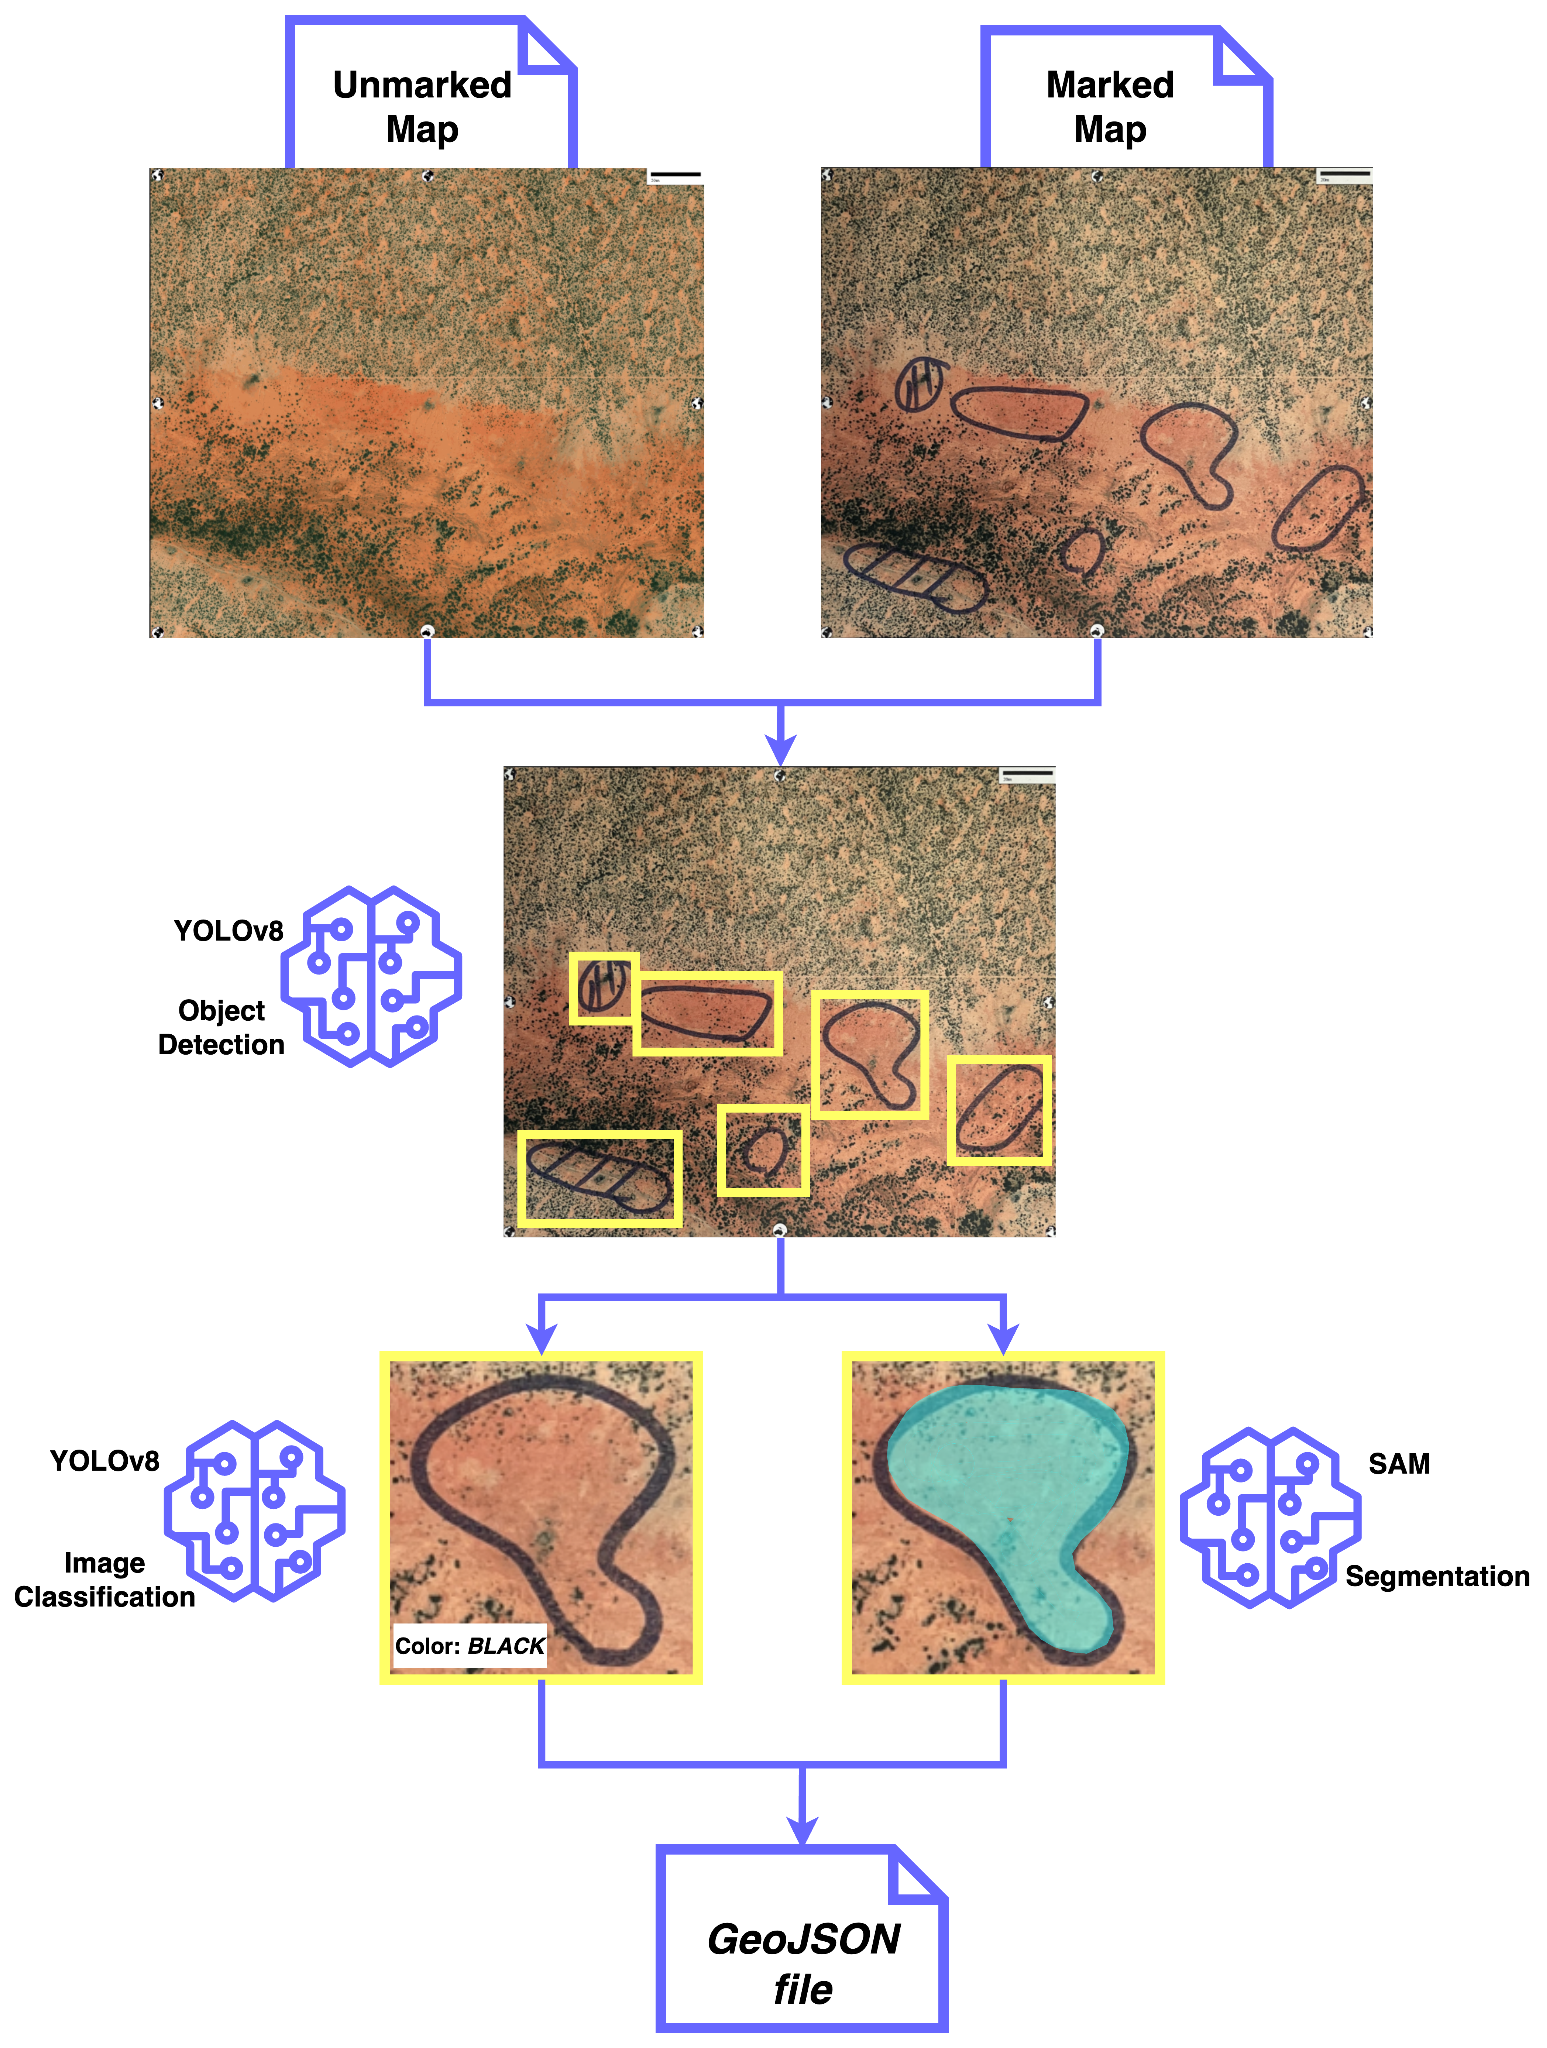
El Sketch Map Tool utiliza una secuencia de modelos de aprendizaje automático (SAM y YOLO) para detectar las marcas en los mapas.
Estos modelos deben entrenarse con muchos ejemplos del mundo real para que sean capaces de identificar correctamente las marcas.
Es posible mejorar aún más la precisión incorporando a los modelos otros casos reales de mapas marcados.
Puedes ayudarnos dando tu consentimiento.
For more detailed and technical information, take a look at our
GitHub
and the following figure.
Si optas por no participar dejando la casilla sin marcar (por defecto)...
... los Sketch Maps cargados se borrarán una vez generados los resultados. Los resultados se almacenan y están disponibles para descargar
durante un período de 24 horas, tras el cual también se eliminan.
Estadísticas básicas
Para conocer mejor el uso general del Sketch Map Tool, almacenamos datos anónimos sobre la generación de mapas
(fecha, centroide, capa, versión, formato de página y orientación).
Preguntas y dudas
Si tiene más preguntas o cualquier duda por favor contáctenos a través de E-Mail.
También es posible configurar el Sketch Map Tool en tu propio servidor. En este caso, ponte en contacto con nosotros.
Preguntas frecuentes
¿Qué son los datos de OSM?
Los datos de OpenStreetMap son geodatos de libre acceso. Más información acá.
¿Cuáles son los niveles de calidad de los OSM datos utilizados en la comprobación de la calidad?
Basado en la
HeiGIT ohsome quality API, las carreteras en los datos del mapa base de OSM se analizan automáticamente en relación a
sus Saturación y actualidad. Por favor, compruebe el capítulo 1.2 Mapa de calidad para una descripción detallada.
¿Para qué preguntas de investigación puede utilizarse el Sketch Map Tool?
The Sketch Map Tool has been primarily developed for research questions related to flooding and disaster risk reduction.
Since then, it has been used world wide for a variety of topics like vulnerability and capacity mapping or risk
mapping in general, city planning, mapping of cultural sites and many more.
Check out our Case Studies to learn more.
¿Cómo funciona el mapeo con el Sketch Map Tool?
La población local puede, por ejemplo, dibujar zonas inundadas como calles, parques, etc., en el Sketch Map impreso.
Los formatos usando papeles grandes también permiten entablar debates en grupo para definir las zonas inundadas.
Los mapas con las marcas pueden ser fotografiados y subidos a la herramienta.
Los archivos GeoTIFF y GeoJSON georreferenciados pueden ser analizados o utilizados posteriormente.
Is it possible to find a certain location by coordinates?
In the search field, instead of a place name, you can simply enter your LAT, LON coordinates including
the hemisphere information (e.g. 1.2921° S and 36.8219° E ).
¿Qué tamaño puede tener mi área de estudio?
Hasta ahora, el Sketch Map Tool sólo se ha evaluado a nivel de barrio o ciudad. La herramienta funciona mejor en áreas de estudio inferiores a 50 km².
Why is there a QR code and markers the Sketch Maps?
These are required for georeferencing. The QR Code contains the ID of the reference map frame and the bounding box coordinates.
The tool employs computer vision algorithms to match uploaded and reference map frames (mainly based on the markers.)
before it transforms and georeferences the uploaded Sketch Maps.
¿Puedo acceder a mis resultados en otro momento?
No, los resultados siempre deben descargarse directamente después de utilizar la herramienta. Si se te olvidó descargar los archivos, puedes simplemente cargarlos y procesarlos de nuevo.
What do I need to keep in mind for the participatory mapping?
Please make sure not to accidentally draw over markers at the edge as they are needed for automatic map detection.
Use thicker felt-tip pens with intense colors; red, blue, and black work best. Prepare the same set of pens for
all interviewers.
Here
you can download the most important tips and questions for the mapping (summarized in a one-pager).
¿Cómo funciona la georreferenciación?
Our georeferencing process employs the Binary Robust Invariant Scalable Keypoints (BRISK)
method from the OpenCV library for feature matching. It begins by extracting bounding box
coordinates and an identification number from a QR code on the uploaded Sketch Map to identify
the corresponding unmarked reference map. Using the BRISK algorithm, the marked Sketch Map is
aligned with the unmarked map. Later, we use the coordinates of the bounding box to transform the
marked map into the world geodetic system (WGS 84), resulting in a georeferenced GeoTIFF file
suitable for geospatial analysis.
The latest version of the Sketch Map Tool leverages advanced Deep Learning models trained to analyze images of
Sketch Maps and identify marked objects within them. Through supervised learning on extensive datasets of labeled images,
these models acquire the ability to distinguish markings from the background of Sketch Maps by analyzing patterns and features.
This enables them to accurately detect and differentiate markings. This predictive capability allows the models
to generalize their understanding and accurately identify markings in new and unseen Sketch Maps.
The Sketch Map Tool also incorporates conventional Computer Vision techniques to precisely position
the Sketch Map within real-world coordinates. Georeferencing images entails detecting and matching specific points,
such as the markers in the corners of the Sketch Maps, between the reference and current input image,
enabling precise spatial alignment. The algorithm detects all markings as either 'Points' or 'Polygons'. Lines are treated as polygons,
and any polygon (whether a line or a shape) below a set size threshold is ultimately classified as a 'Point'.
¿Cómo puedo garantizar resultados óptimos al fotografiar los Sketch
Maps?
Las imágenes deben estar en formato JPG o PNG. El archivo no puede superar los 500 MB. La georreferenciación funciona mejor si escaneas el Sketch Map anotado con una resolución de 300 dpi.
Las fotos deben tomarse desde arriba en un ángulo de 180 grados (paralelo sobre el Sketch Map) para obtener el mejor resultado.
¿Cómo puedo comprobar si la georreferenciación es correcta?
You can open the TIFF file in a geographic information system (GIS), such as ArcGIS or QGIS, to check
this.
If you upload the file there and insert a basemap (for example the OSM basemap), you can see if the georeferencing
has worked. The Sketch Map should match the base map.
¿Por qué mi archivo GeoTIFF generado parece extraño?
Please first try to open the file in a geographic information system (GIS) such as ArcGIS or QGIS.
The georeferencing may have worked even if the GeoTIFF file does not look right. If it still appears incorrect in
the GIS,
the map might not have been properly detected by the tool in the photo, which could have several possible causes.
For example, the photo may have been taken from the wrong angle or the markers may have been painted over.
¿Qué puedo hacer si el mapa satelital que he impreso está demasiado oscuro?
En caso de que uses imágenes satelitales como mapa base, revisa la saturación del color de tu imagen.
Si el fondo está muy oscuro, considera usar OSM como mapa base.
¿Cuánto tiempo se guardan los Sketch Maps?
La(s) imagen(es) cargada(s) de tu(s) Sketch Map(s) se almacenará(n) en nuestro servidor para su procesamiento (georreferenciación y detección de marcas)
hasta que se generen los resultados. Si nos autoriza, la(s) imagen(es) se almacenará(n) a largo plazo para futuras mejoras de la Sketch Map Tool, tales como
el entrenamiento de nuestros modelos de aprendizaje automático que detectan sus marcas en las imágenes cargadas.
Si no das tu consentimiento, las imágenes cargadas se eliminarán una vez generados los resultados.
Los resultados se almacenan y están disponibles para su descarga durante un periodo de 24 horas, tras el cual también se borran.
¿Cuánto tiempo tengo para subir los Sketch Maps para la digitalización?
Esto es posible hasta 12 meses después de la creación de las mapas, después de lo cual la digitización ya no funcionará.