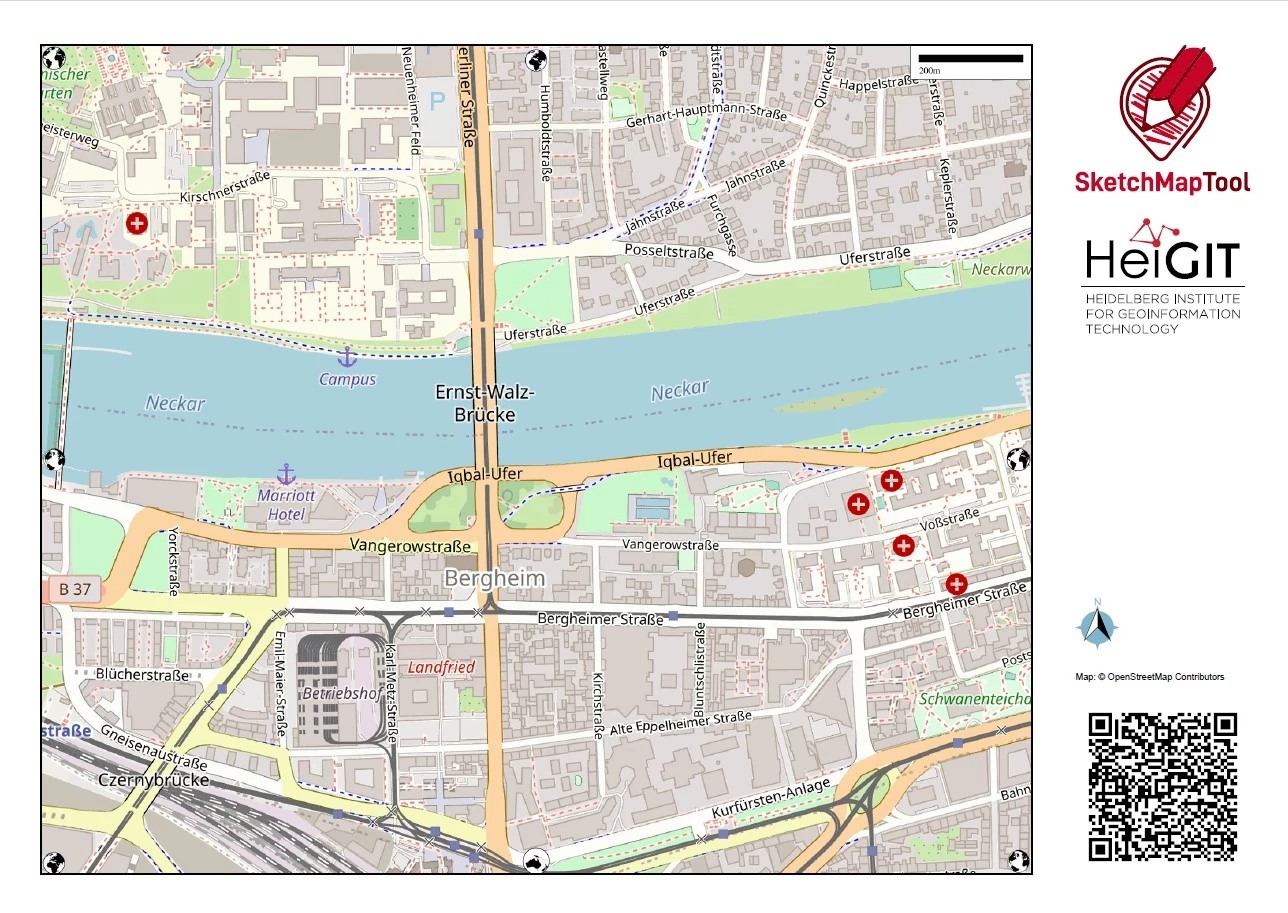
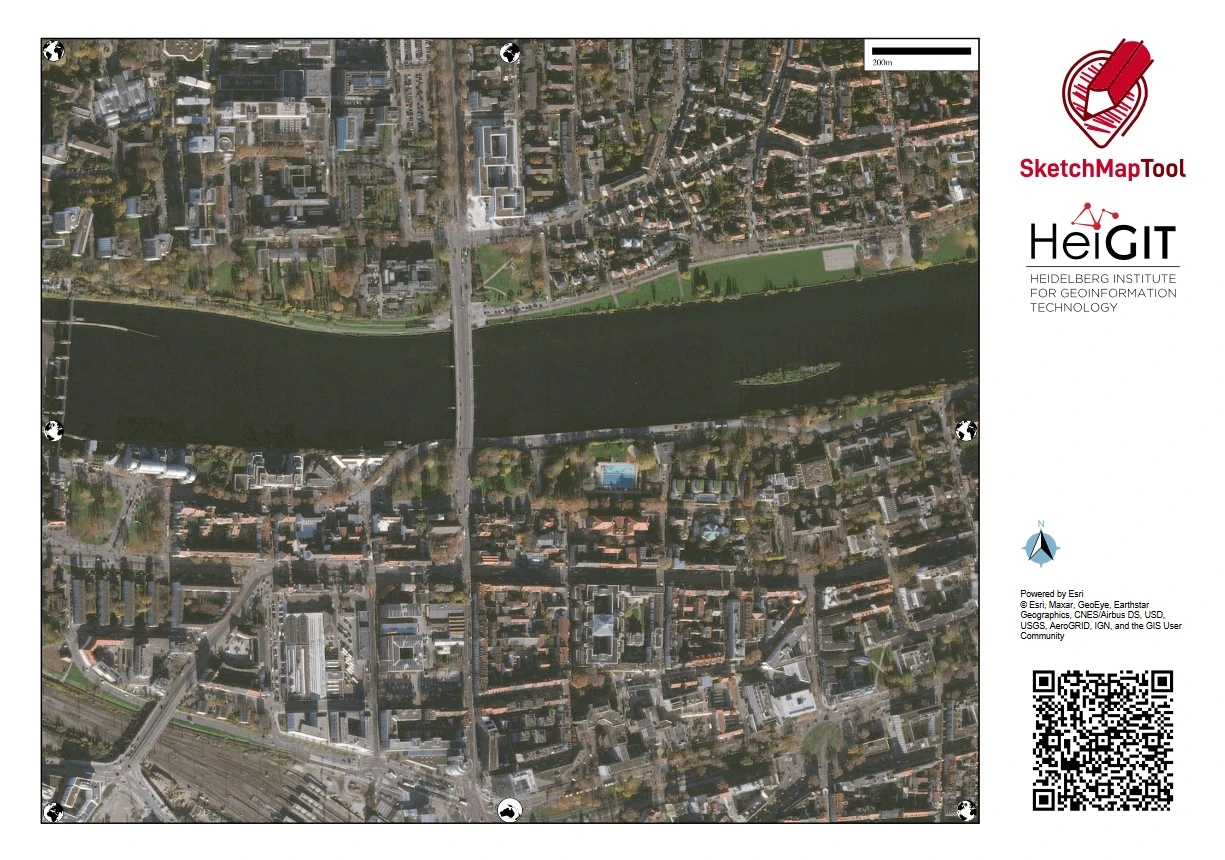
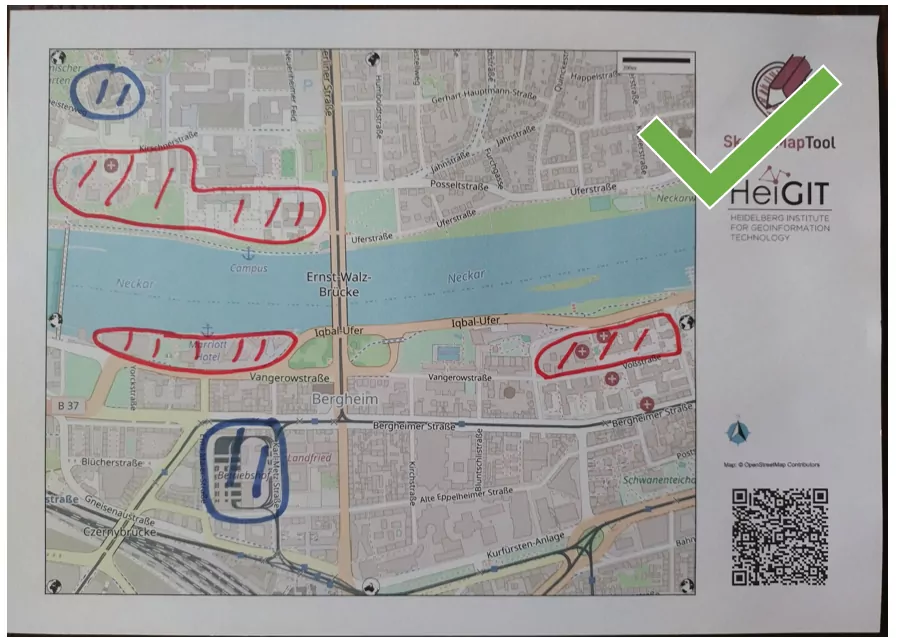
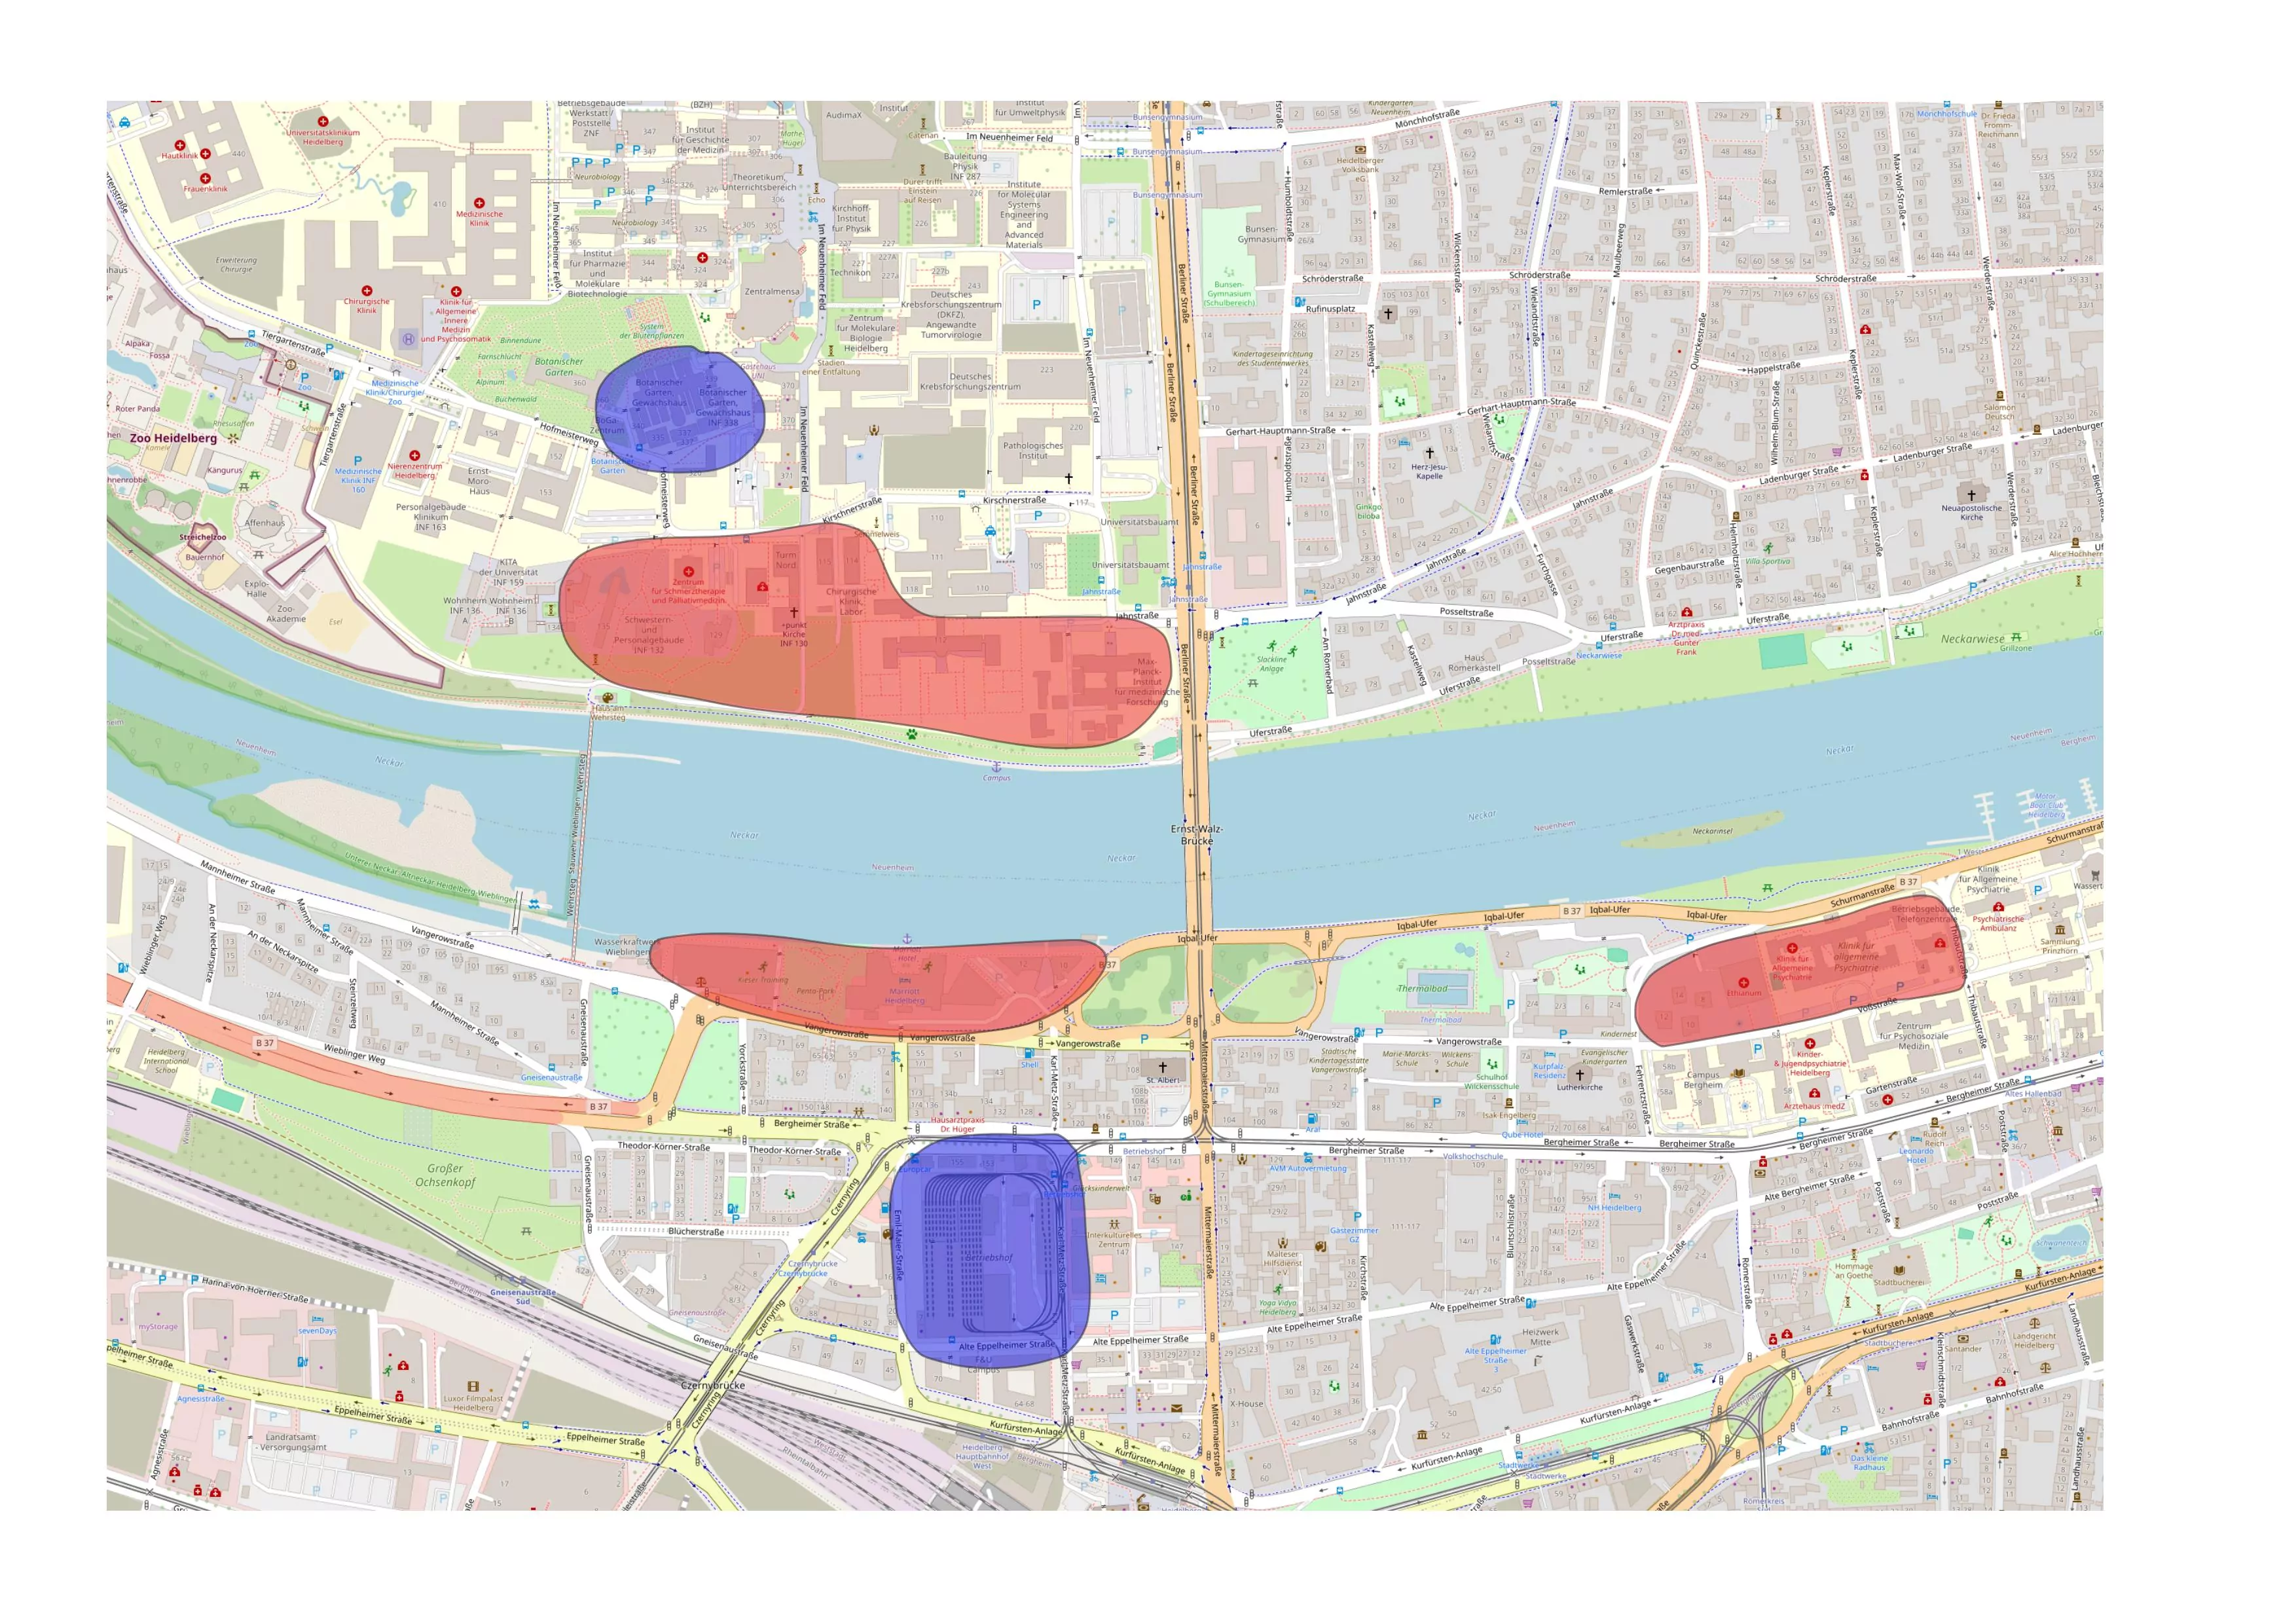
The Step-by-Step Instructions will guide you through the Sketch Map Tool and provide useful recommendations. You can also download and print the manual.
Answers to the Frequently Asked Questions can be found in the FAQ section below.
Here you can download the most important tips and questions for the mapping on one page.
Our training platform provides distinct training exercises to further explore the Sketch Map Tool and sketch mapping in general. These exercises are primarily designed for workshop settings, allowing for collaborative discussion of your experiences.
We are committed to continually enhancing the tool, so please report any technical problems to the Sketch Map Tool user support.
Step-by-Step Instructions
1
Create paper maps to collect data1.1 Define your area of interest and choose a base map
The first step in using the Sketch Map Tool involves creating a printable Sketch Map.
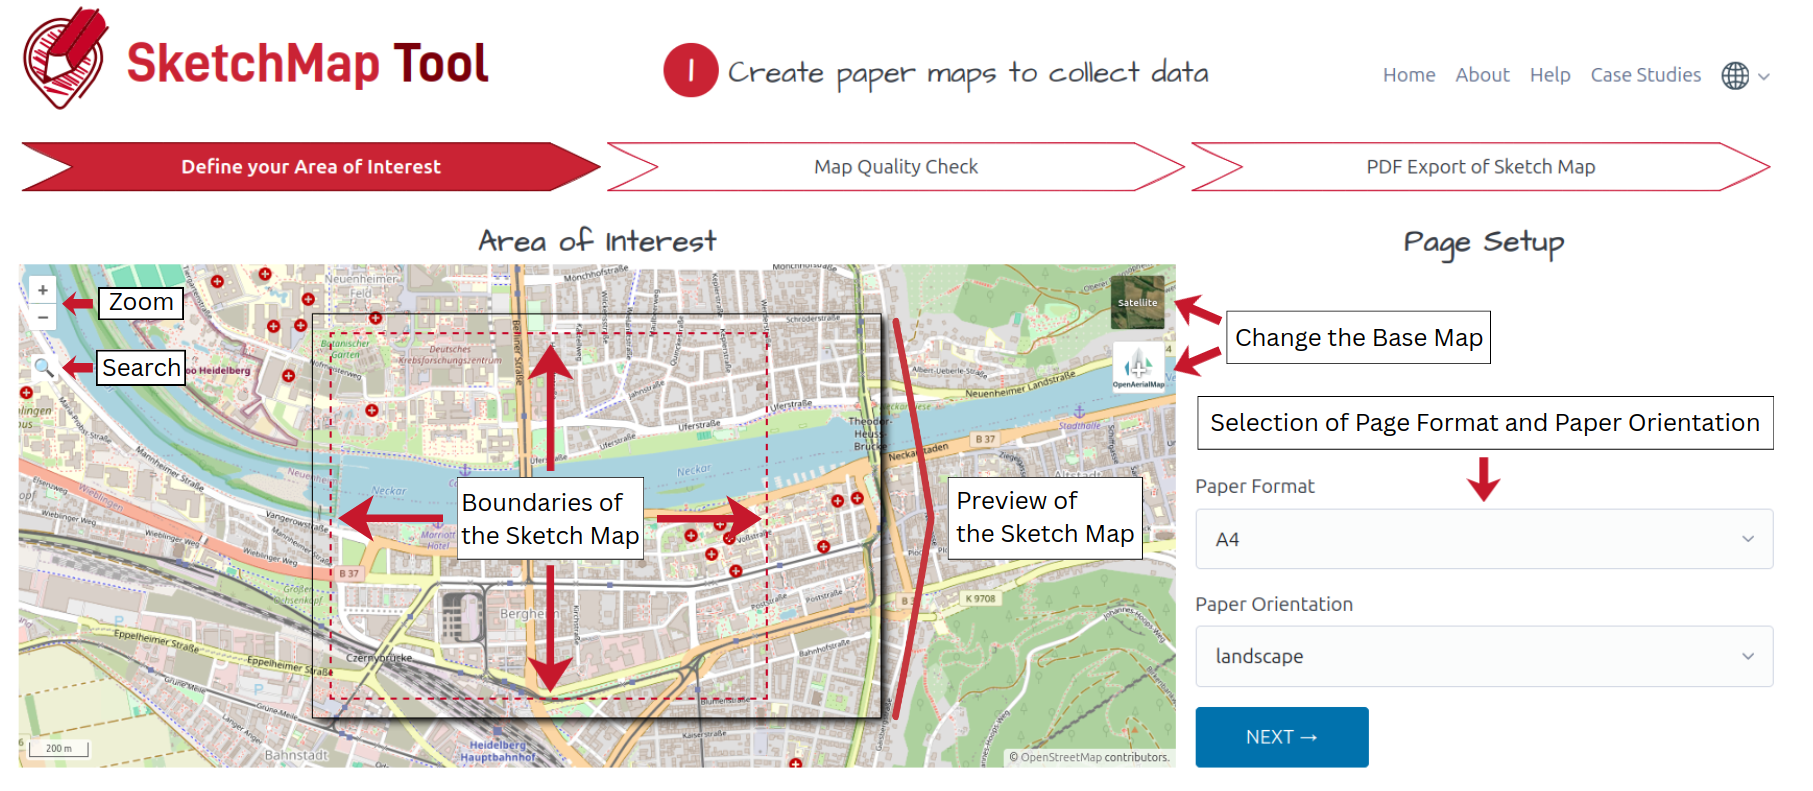
Select your area of interest, either by zooming into the map preview or using the search
function in the sidebar. You can search for place names and coordinates.
Select from different paper formats and the appropriate page orientation. The dashed red line
represents the
boundaries of your area of interest, which will be printed on the Sketch Map.
Initiate the map creation by clicking the blue "next" button.
How to use a drone or satellite image from OpenAerialMap as base map
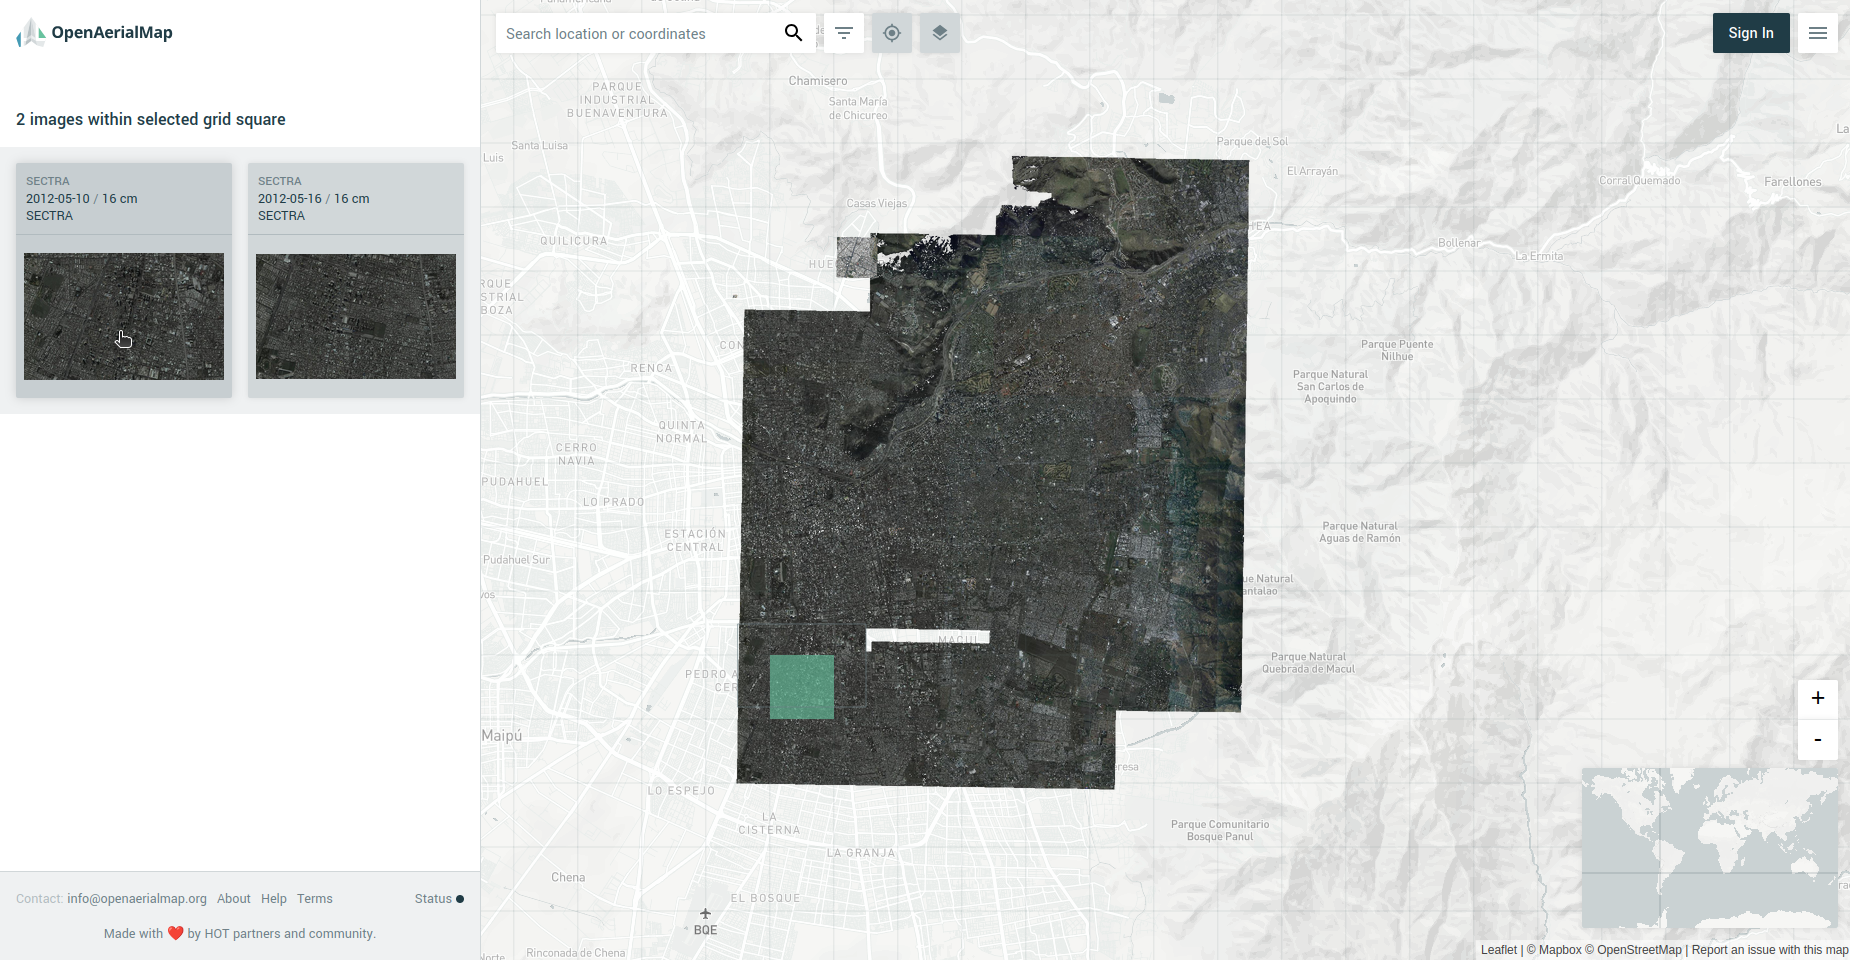
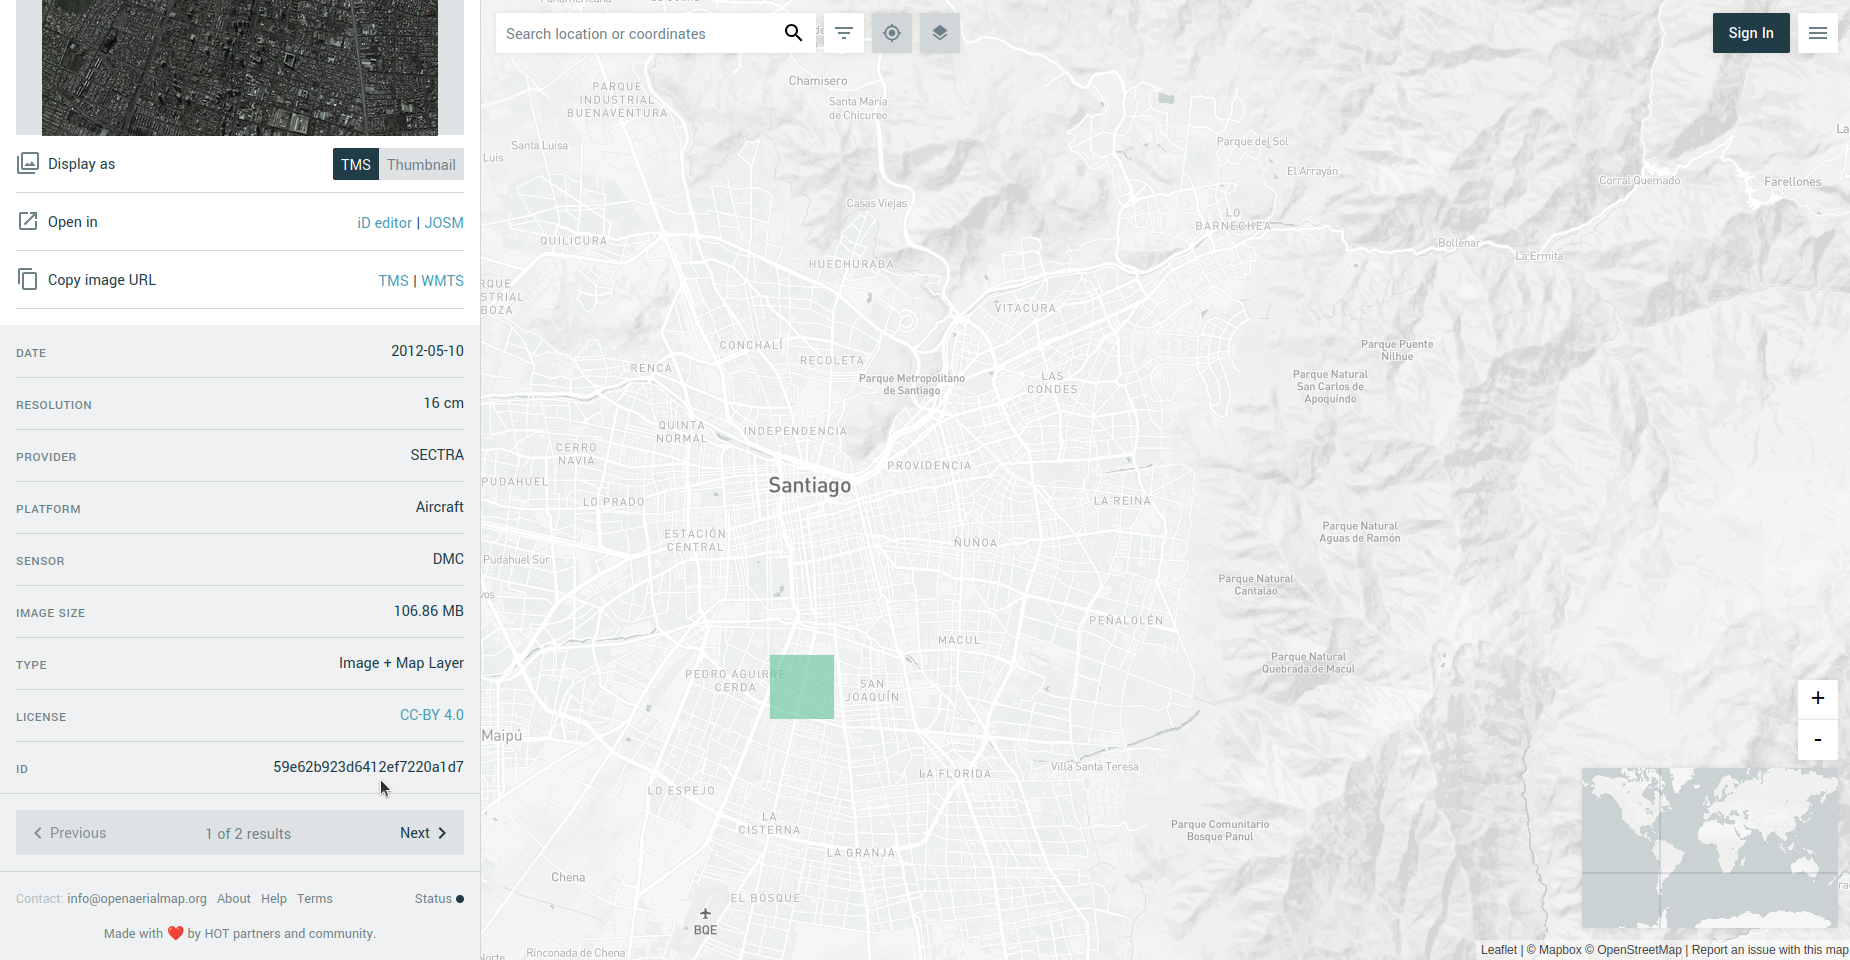
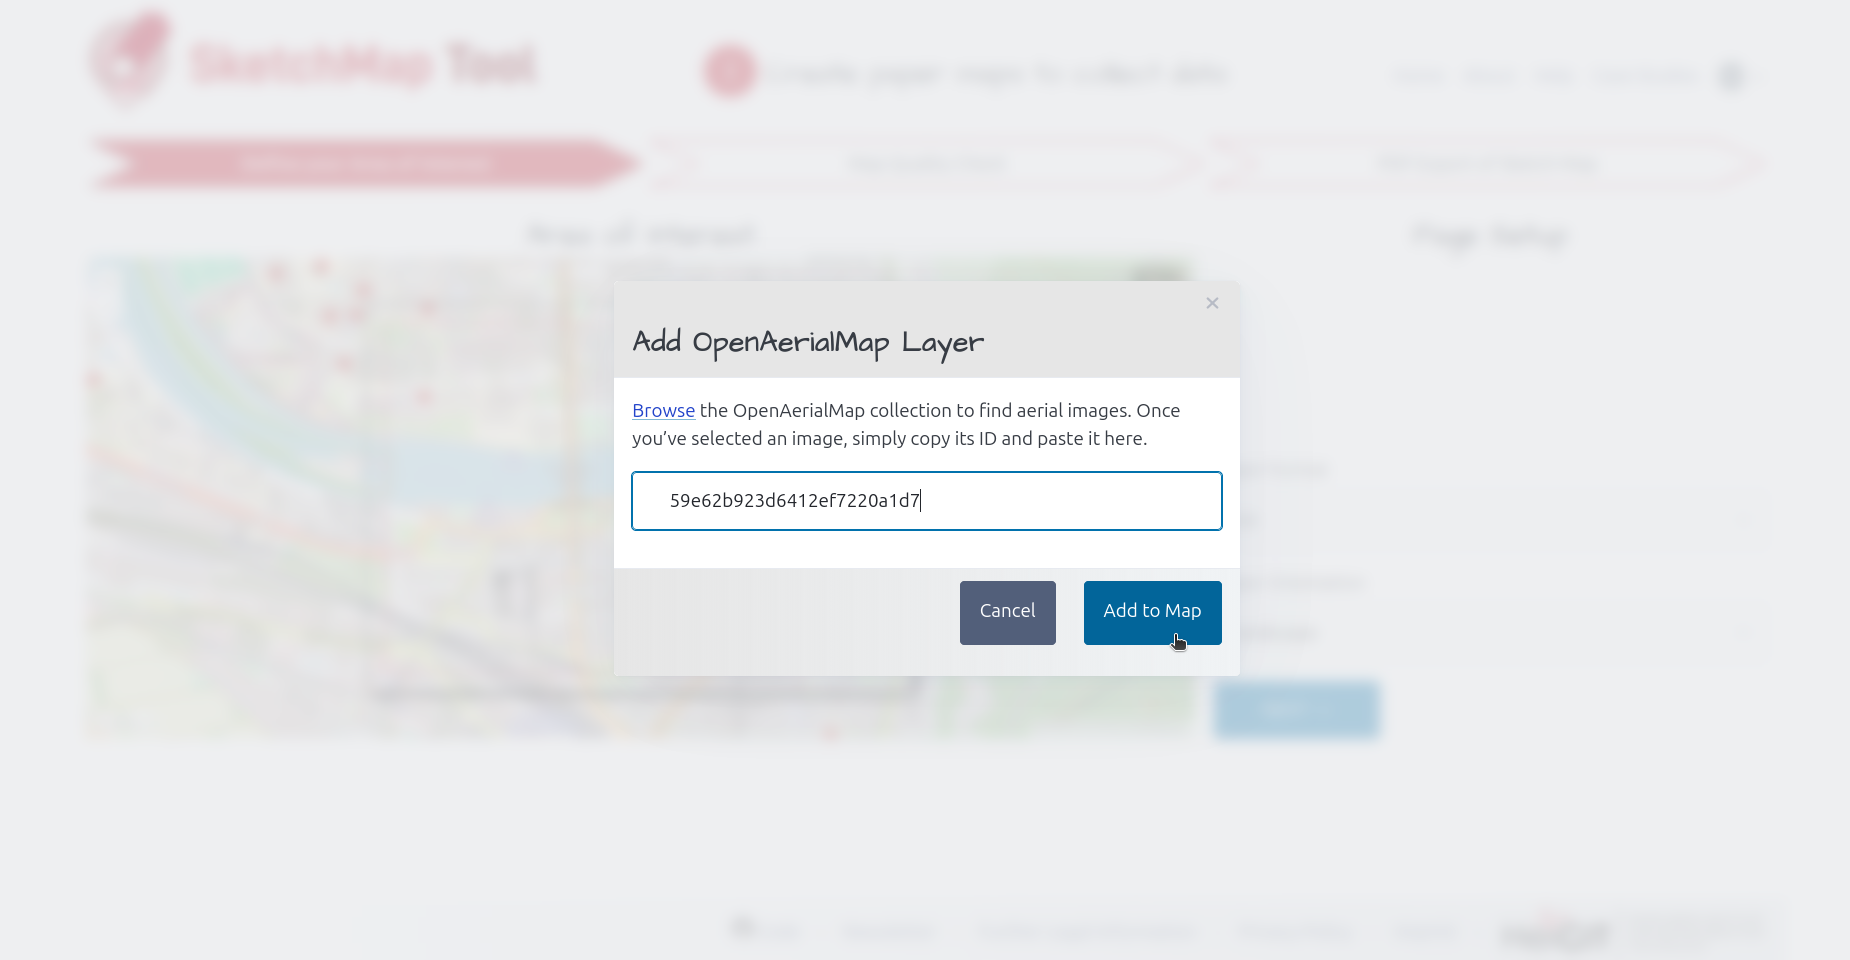
In case of choosing OpenAerialMap you will be redirected to their website in order to browse for your imagery. Choose an image by
clicking on it on the left hand site and copying its ID and pasting it back to the Sketch Map Tool prompt. Please consider that OpenAerialMap does not yet have global coverage.
Therefore, it is necessary to check whether images are available for the area of interest.
If so, OAM can serve as an alternative to outdated or low-resolution ESRI satellite images.
Browse for your imagery
Click on a the imagery of your choice to retreieve the image ID
Paste image ID in Sketch Map Tool prompt
Tip: Consider creating several Sketch Maps of the same area with different base
layers if you are unsure which one will work best!
Choose the right paper format to fit your mapping needs:
Group mapping is easier on larger maps (A2 or A1, depending on your group size).
For data collection in the field, A4 or A3 are easier to handle.
Tip: If the area is too big, consider creating multiple Sketch Maps!
1.2 Export Sketch Map as PDF
The generated Sketch Map for your selected area of interest can be downloaded as a PDF file by clicking on the blue button.
Some recommendations:
Prepare separate maps for each topic or per person/group because it is difficult to read and analyze
too many markings from one map.
You can print out one map layout as often as you want.
We recommend printing the maps on matte, non-reflective paper.
Name your maps appropriately; Putting names on the downloaded Sketch Maps can help
you in organizing your maps.
THEN: Data collection in the field
The printed Sketch Map is now ready to be used for your mapping activity. The way you draw on your map determines the detectability of your markings.
To help you in the field, we provide two handouts with best practices that you can print out:
The Sketch Map Tool detects shapes (point and polygons) and colors. To make sure your markings are detected:
Use contrast rich colors - red, blue, green, and black work great
Use thick and opaque pens (e.g. felt-tip markers)
Draw closed shapes with continuous lines (not dashed)
Please make sure to not draw over the black-and-white symbols on the map margin.
Tip: Test your pens and the detectibility of your markings before your mapping activity.
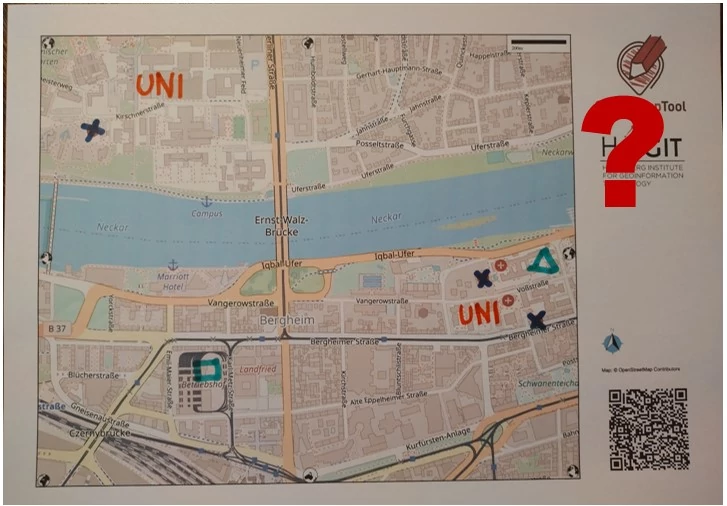
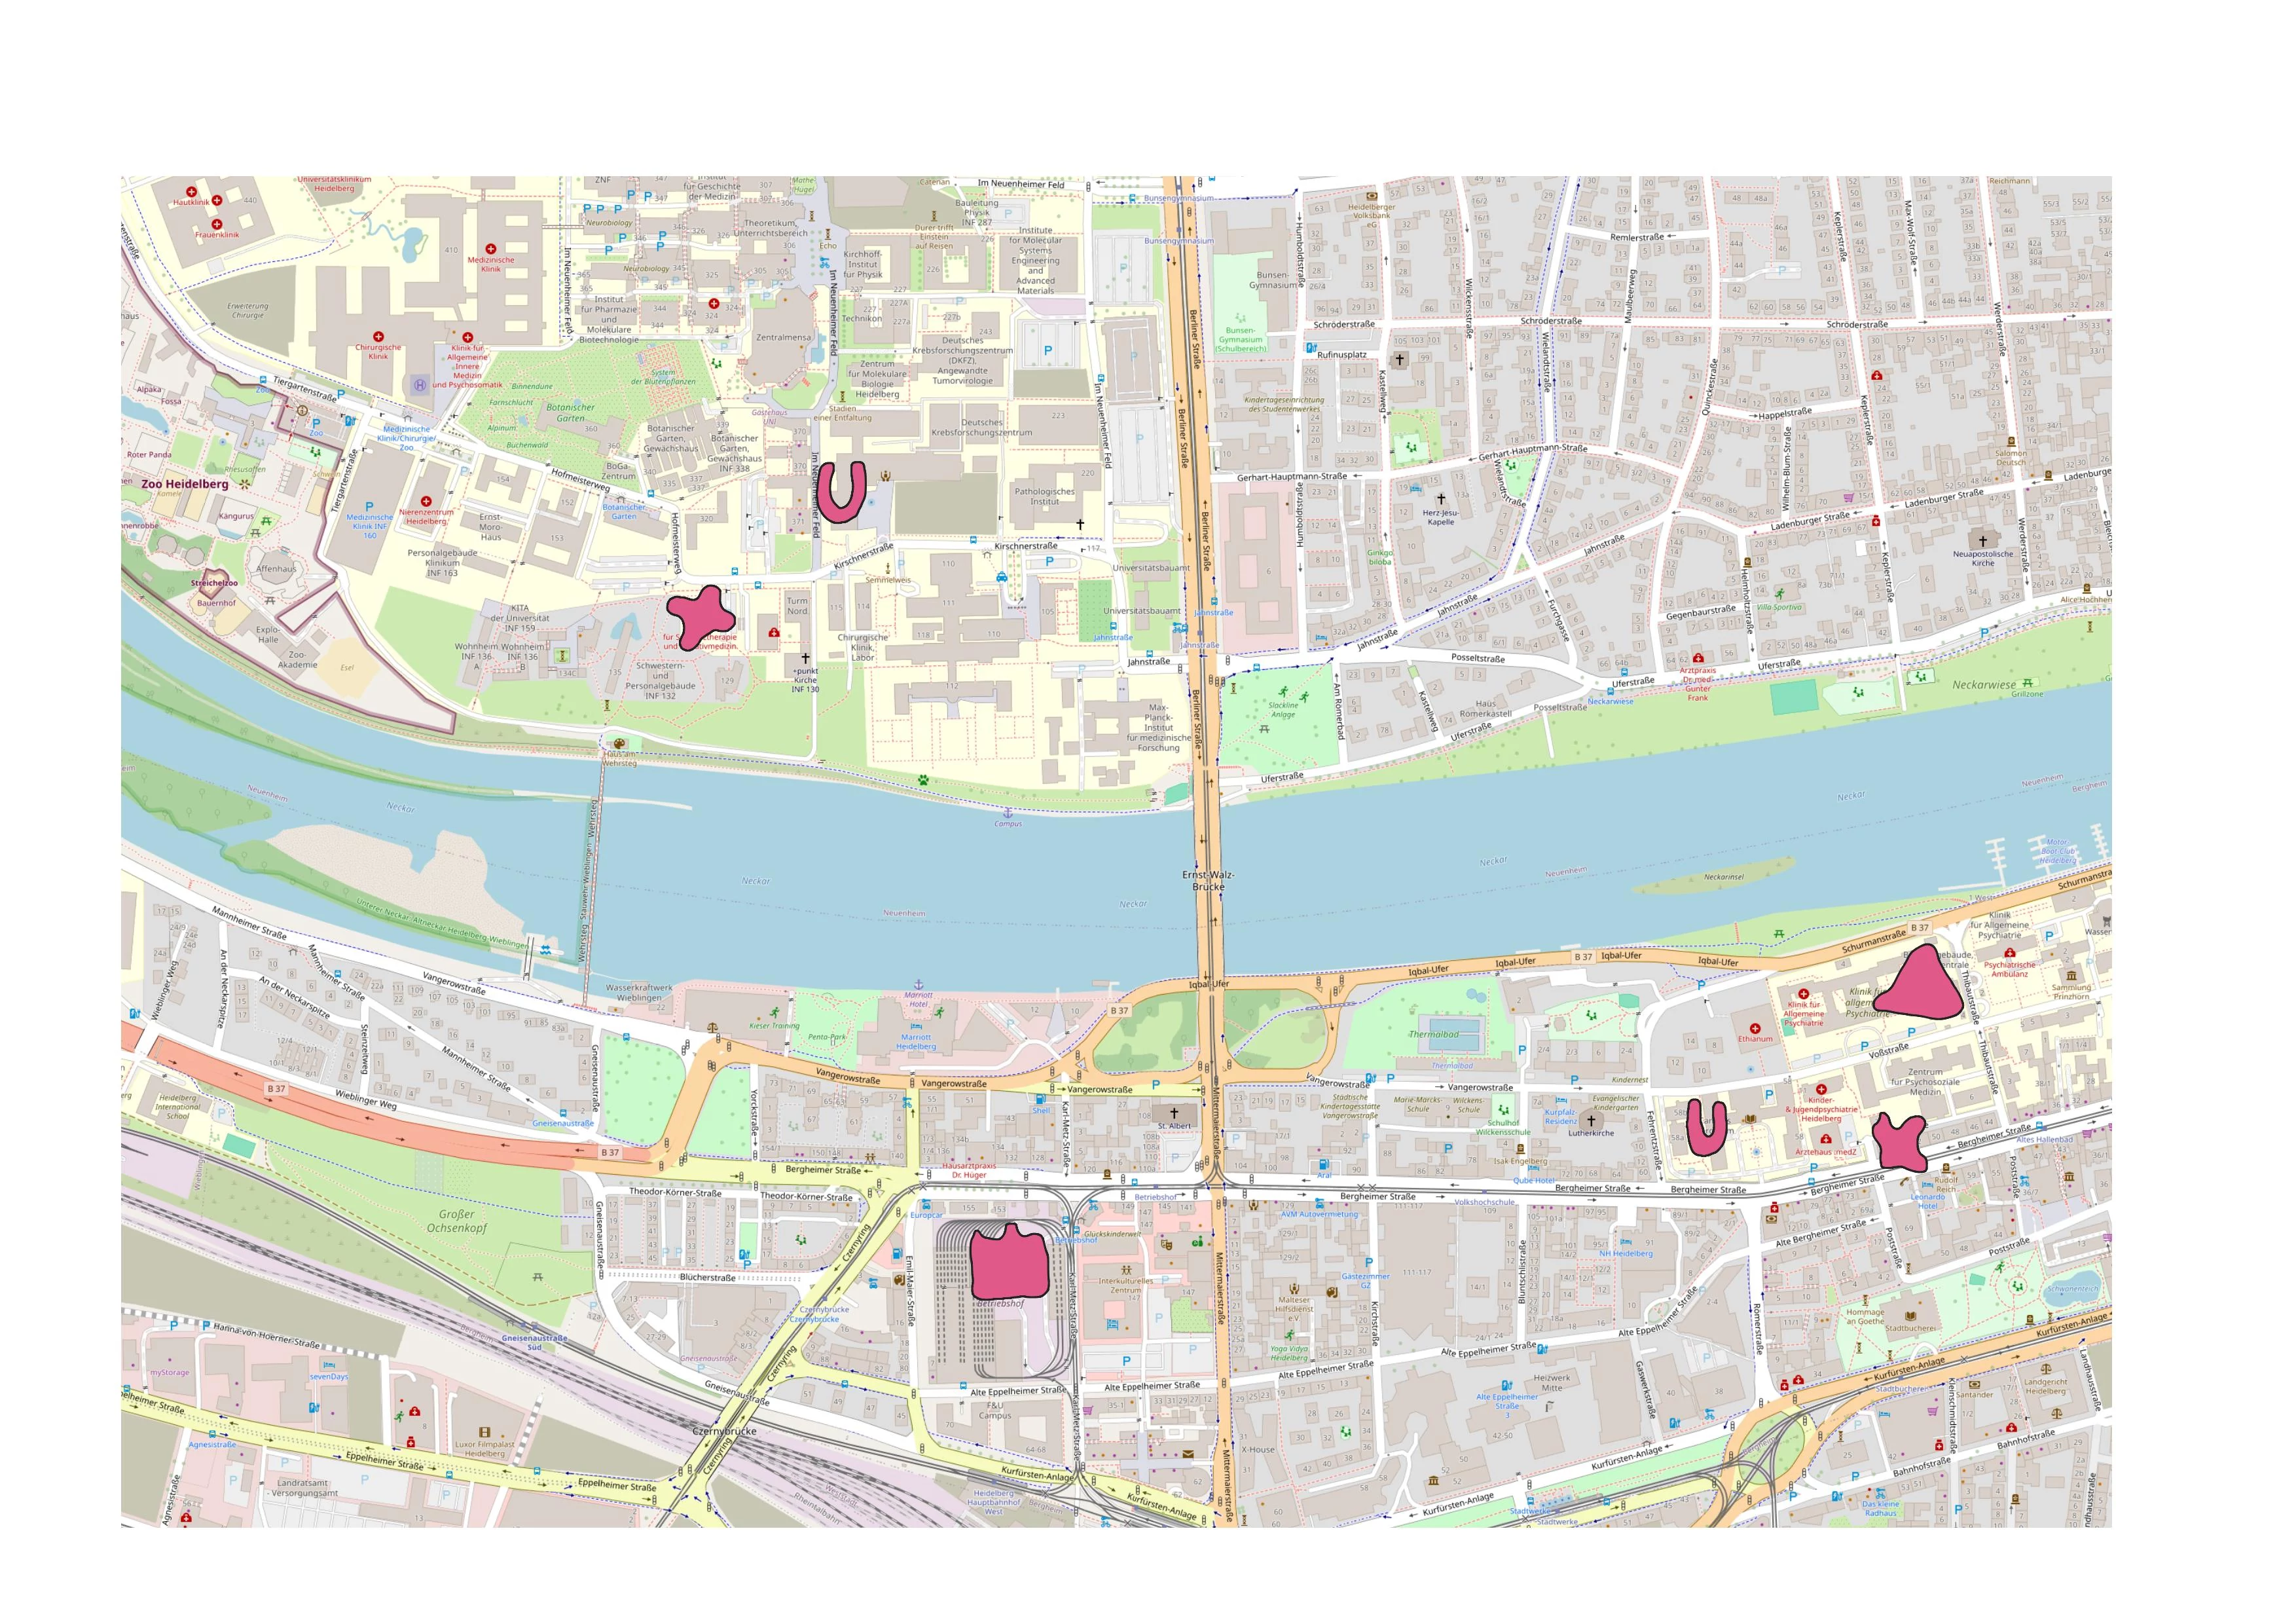
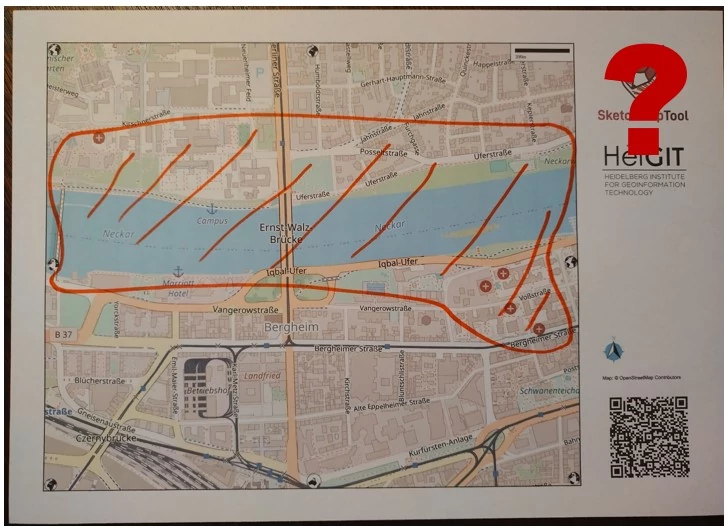
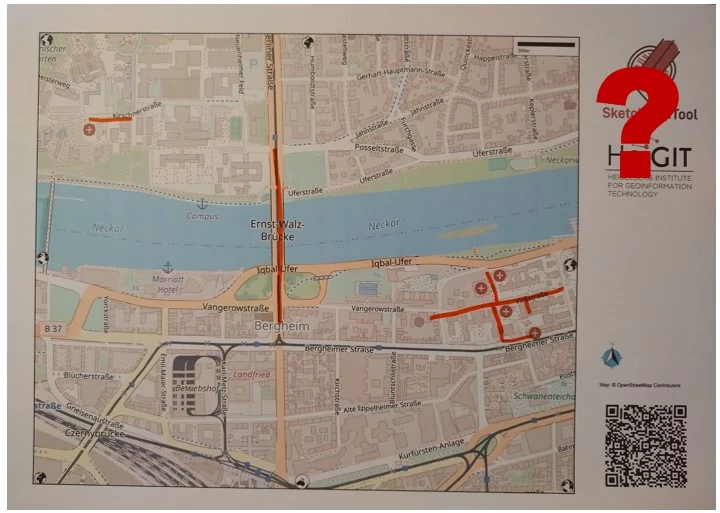
Original Image: Markings are thick, opaque and have good contrast.
Result: All shapes and colors were detected.
Click here for more examples
Original Image: Markings are thick, opaque and have good contrast.
Result: All shapes and colors were detected.
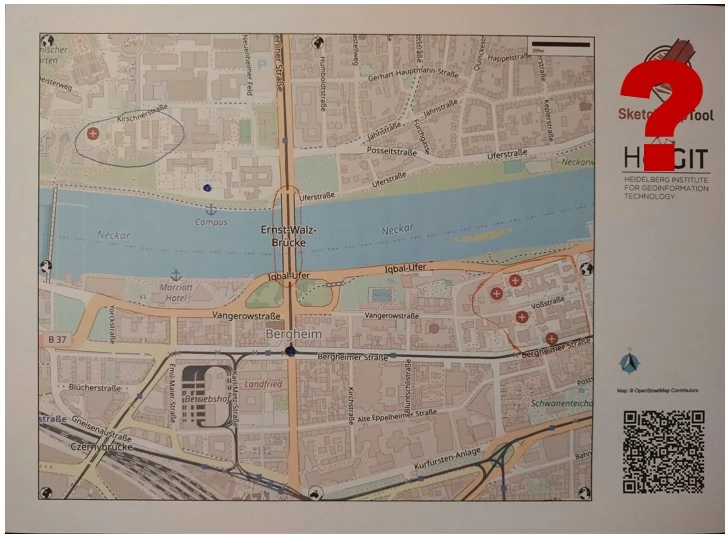
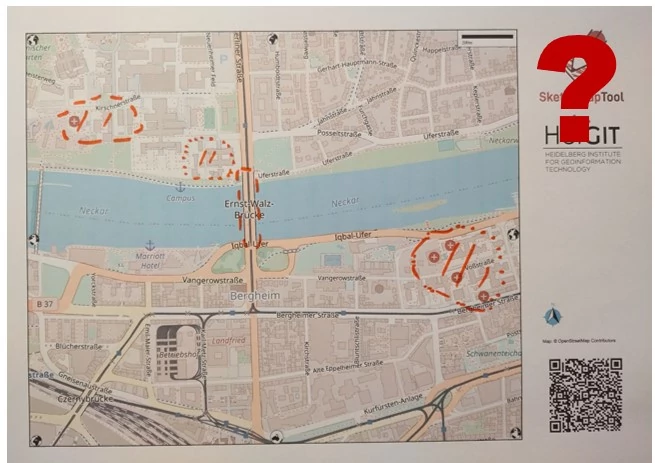
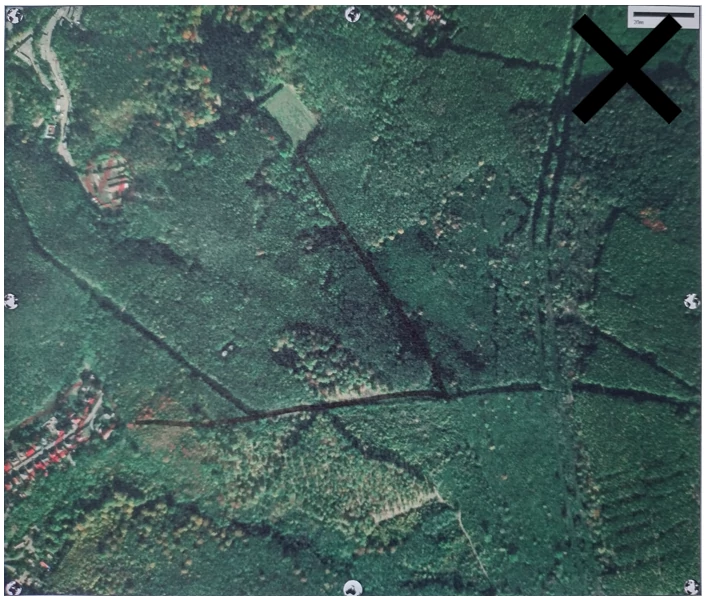
Original Image: marked with different shapes.
Result: The shape of everything you write or draw on the map with a color that the
tool recognizes can be detected as a marked area (polygon).
However, in some cases, they may not be detected at all.
Recommendations
Line Thickness
Recommended
Use thick felt-tip pens with intense colors.
Not recommended
Thin lines in light colors might not be detected. We generally recommend to test your pens and the
detectability of your markings with the Sketch Map Tool before your mapping activity.
Polygon Outlines
Recommended
For polygons, draw their outline as a closed, strong, and continues shape.
You do not need to fill the polygons, and the pattern you draw in the middle will not be detected.
In general, smaller polygons are detected better than large polygons.
Not recommended
Gaps in the outline could lead to mistakes in the detection.
Large polygons might not be detected properly. If you need to draw large polygons, please consider to zoom out.
If you just draw a line, the marked area of the line will be detected.
Nevertheless, we do not recommend to use lines, since the model has not been trained to detect lines
and doing so could lead to mistakes in detection of marking.
If you want to draw a point, draw a larger circle to improve the detection.
If you want to draw lines, draw strong, non-dashed lines with intense colors.
Hint: If you need the marking as a line or a point shape,
you can easily transfer it manually or digitalize it yourself,
for example, in QGIS (see Training Exercise 4)
Satellite Base maps
Recommended
Check the darkness of the Satellite base map, especially before printing it in black-and-white.
Make sure you use bright colors and mark the maps especially clearly. Sometimes
it might be helpful to use both Sketch Maps with satellite imagery
and OSM base maps for the mapping.
Not recommended
Small polygons can be especially difficult to detected.
2
Paper to GIS: Automatically digitize collected data2.1 Photograph your marked
Sketch Maps
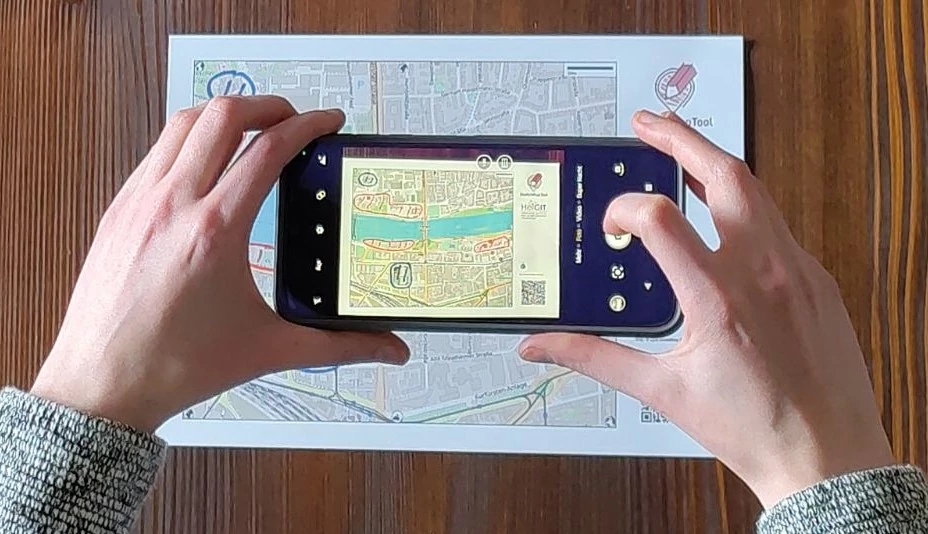
Take a photo of you Sketch Map.
Make sure that all map elements (QR code and entire map) are visible
Take the photo from above at a 180 degree angle (not tilted)
Ensure good lighting conditions (no shades)
Tip: If you experience problems take new photo. Small changes in lightning and angle can make a difference!2.2 Upload your Sketch Maps
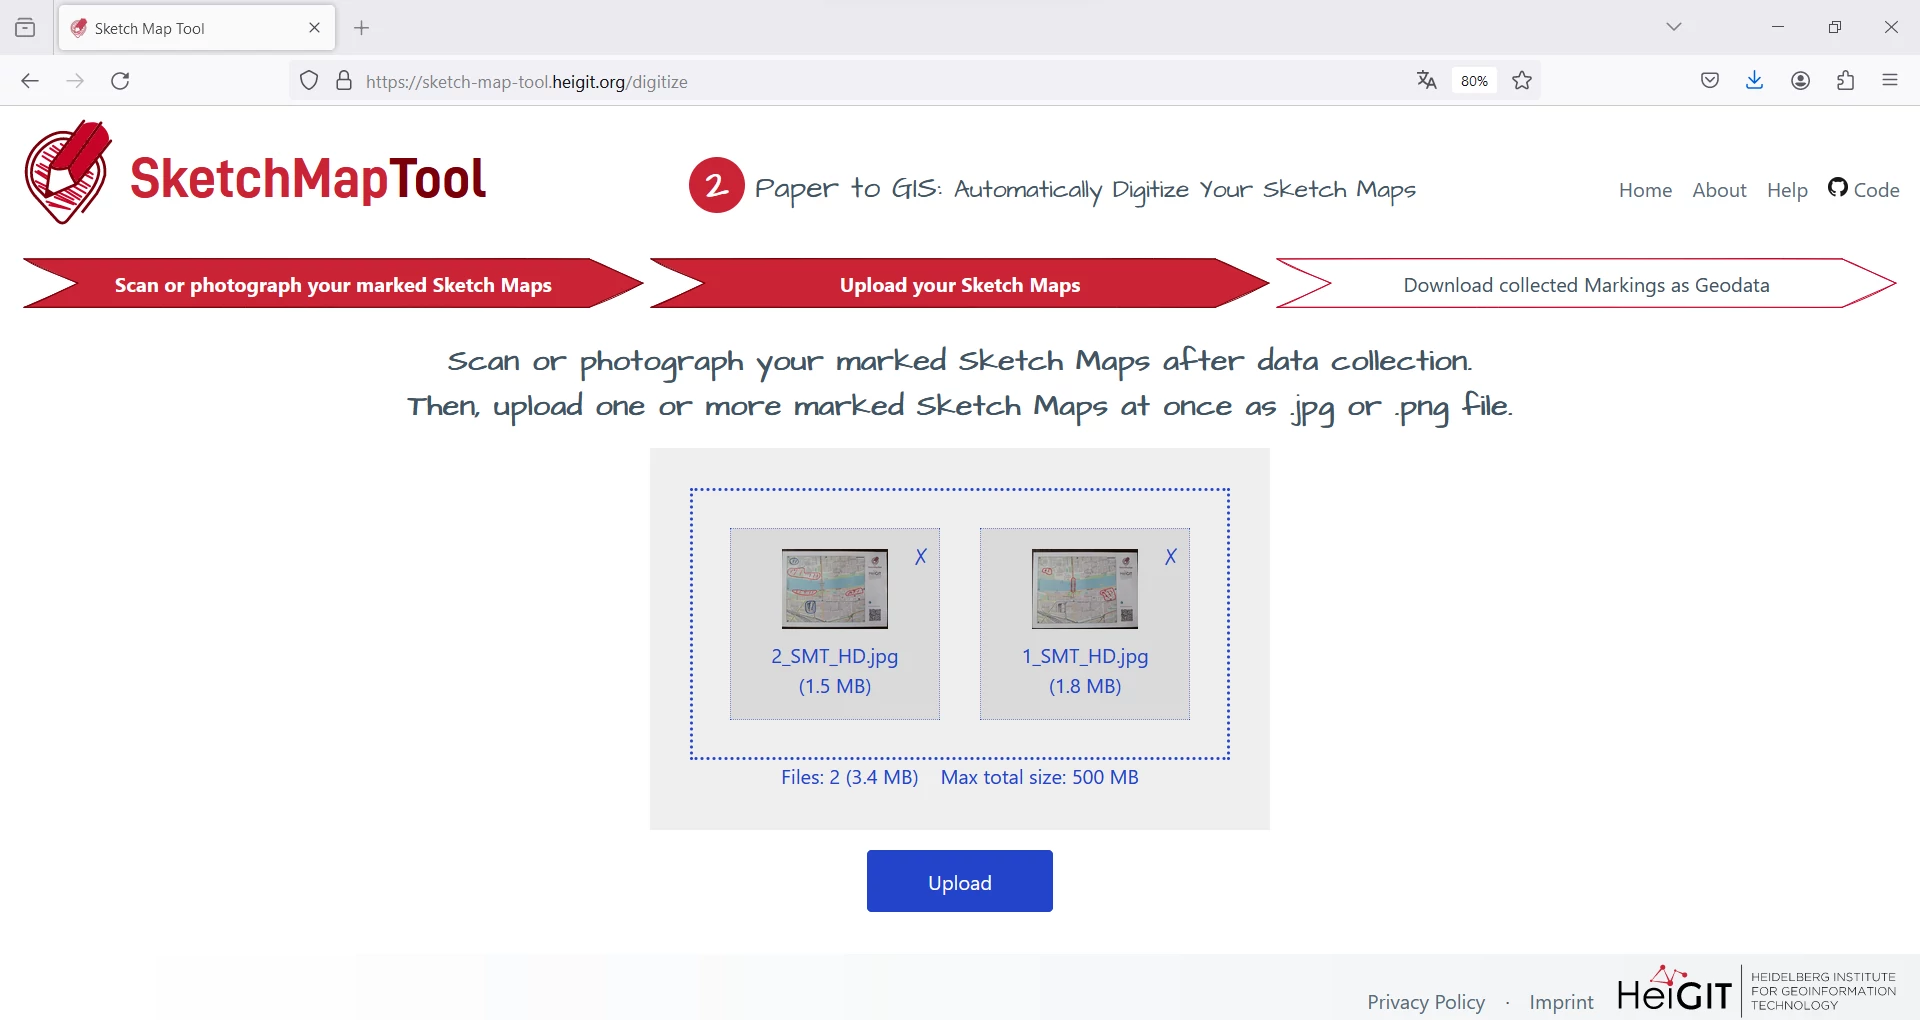
Use the upload dialog to upload your Sketch Map(s).
Note: Until your result is ready it can take up to 2 minutes per Sketch Map.
2.3 Download detected Markings as Geodata
Finally, you can download the detected markings of all your Sketch Map(s) as vectors in one GeoJSON. Additionally, the georeferenced Sketch Maps are made available as a GeoTIFFs.
FINALLY: Import Geodata in a Geographic Information System (GIS), e.g. QGIS
The gained geodata can be even more valuable for the communities and humanitarian
organizations if you create result maps or analyze it further. There are many different
analyses possible based on your gained map data.
To open, visualize and work with the downloaded geodata you need some type of GIS.
We recommend using QGIS because it is open-source and provides the most flexibility for analyzing and visualizing your data.
Alternatively you could also use browser based GIS-Applications like uMap.
These browser-based applications are easier to use for beginners, but limited in their functionality.
Please also keep in mind data security questions when using Online GIS-Applications for visualizing your data!
For more tips on how to open and analyze the downloaded geodata and how to create a result map in QGIS as well as in uMap,
take a look at the following
QGIS Training Lectures.
Here you can see an overview on the characteristics of GeoTIFF and GeoJSON and how the results could look like:
GeoTIFF
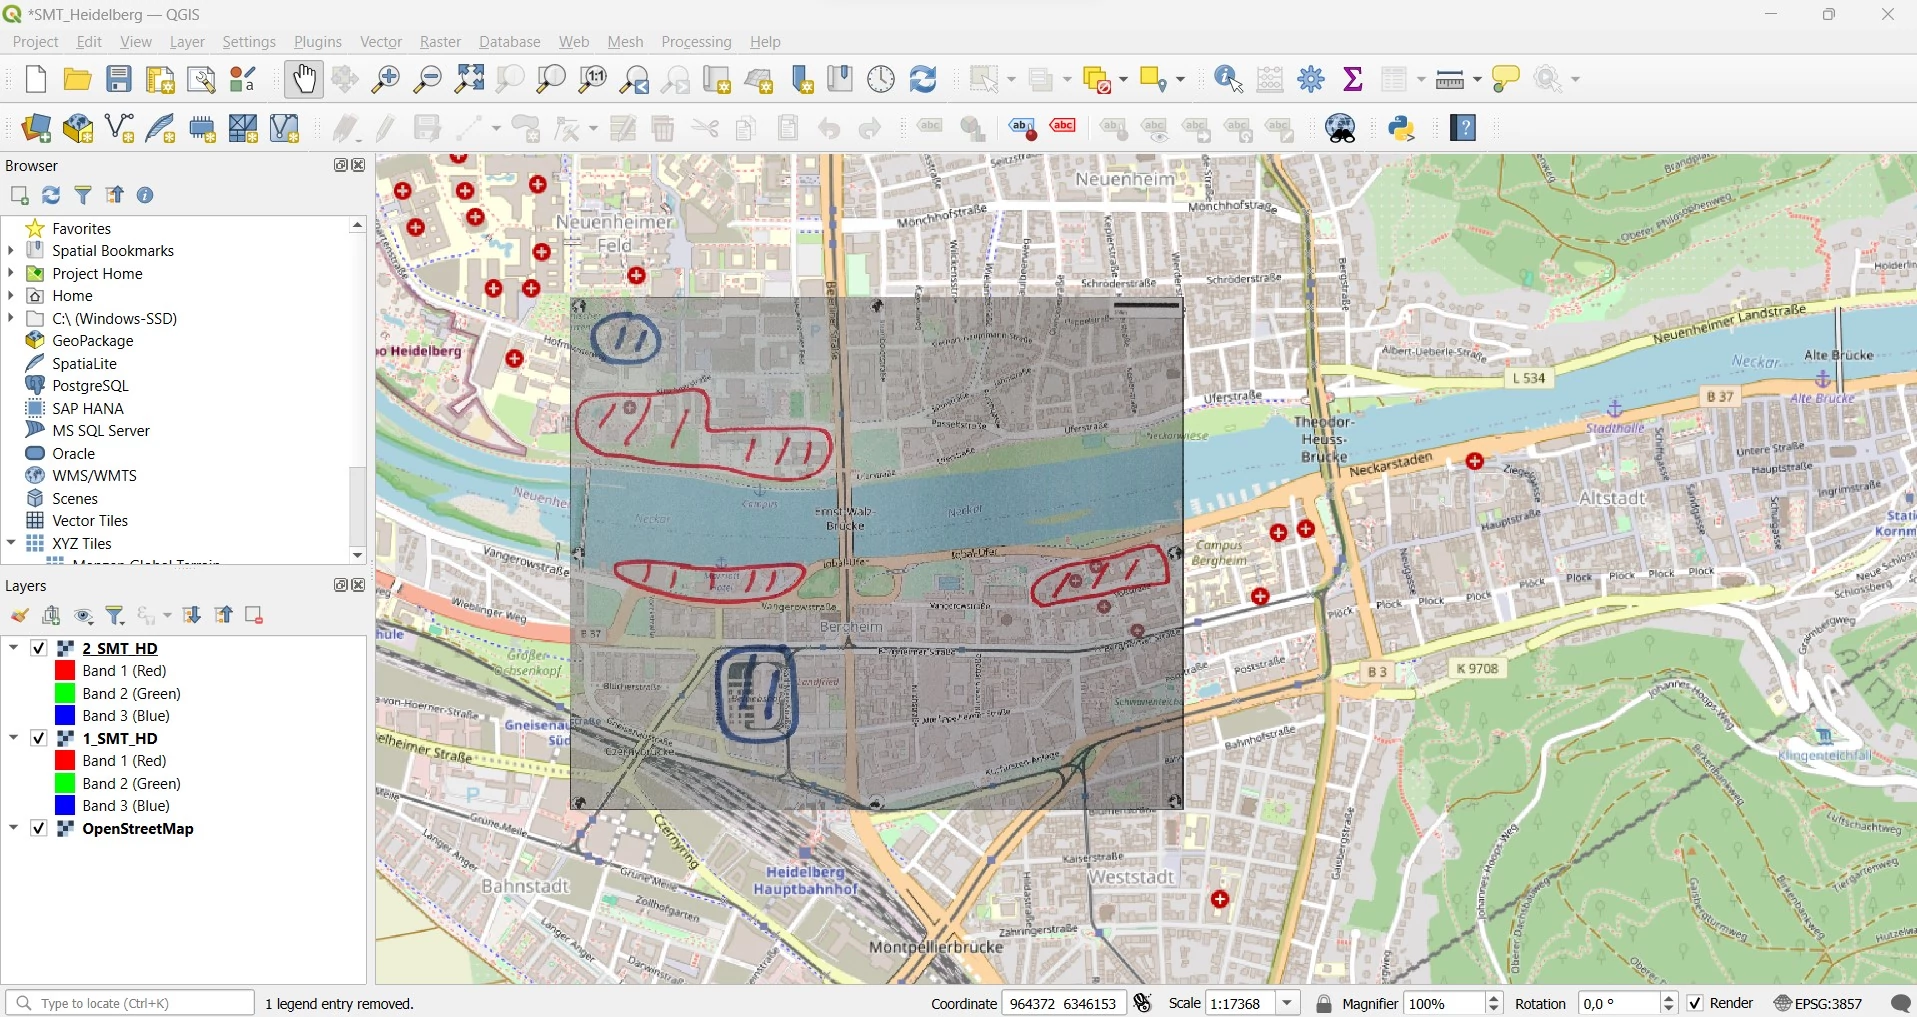
The GeoTIFF output file consists of a georeferenced "picture" for each of your uploaded Sketch
Maps. When you open the GeoTIFF files in a GIS, it should look similar to this example and shows all
your sketch map(s) as separate layers.
The GeoTIFF can be used as a ground truth layer for validation and manual correction in QGIS
GeoJSON
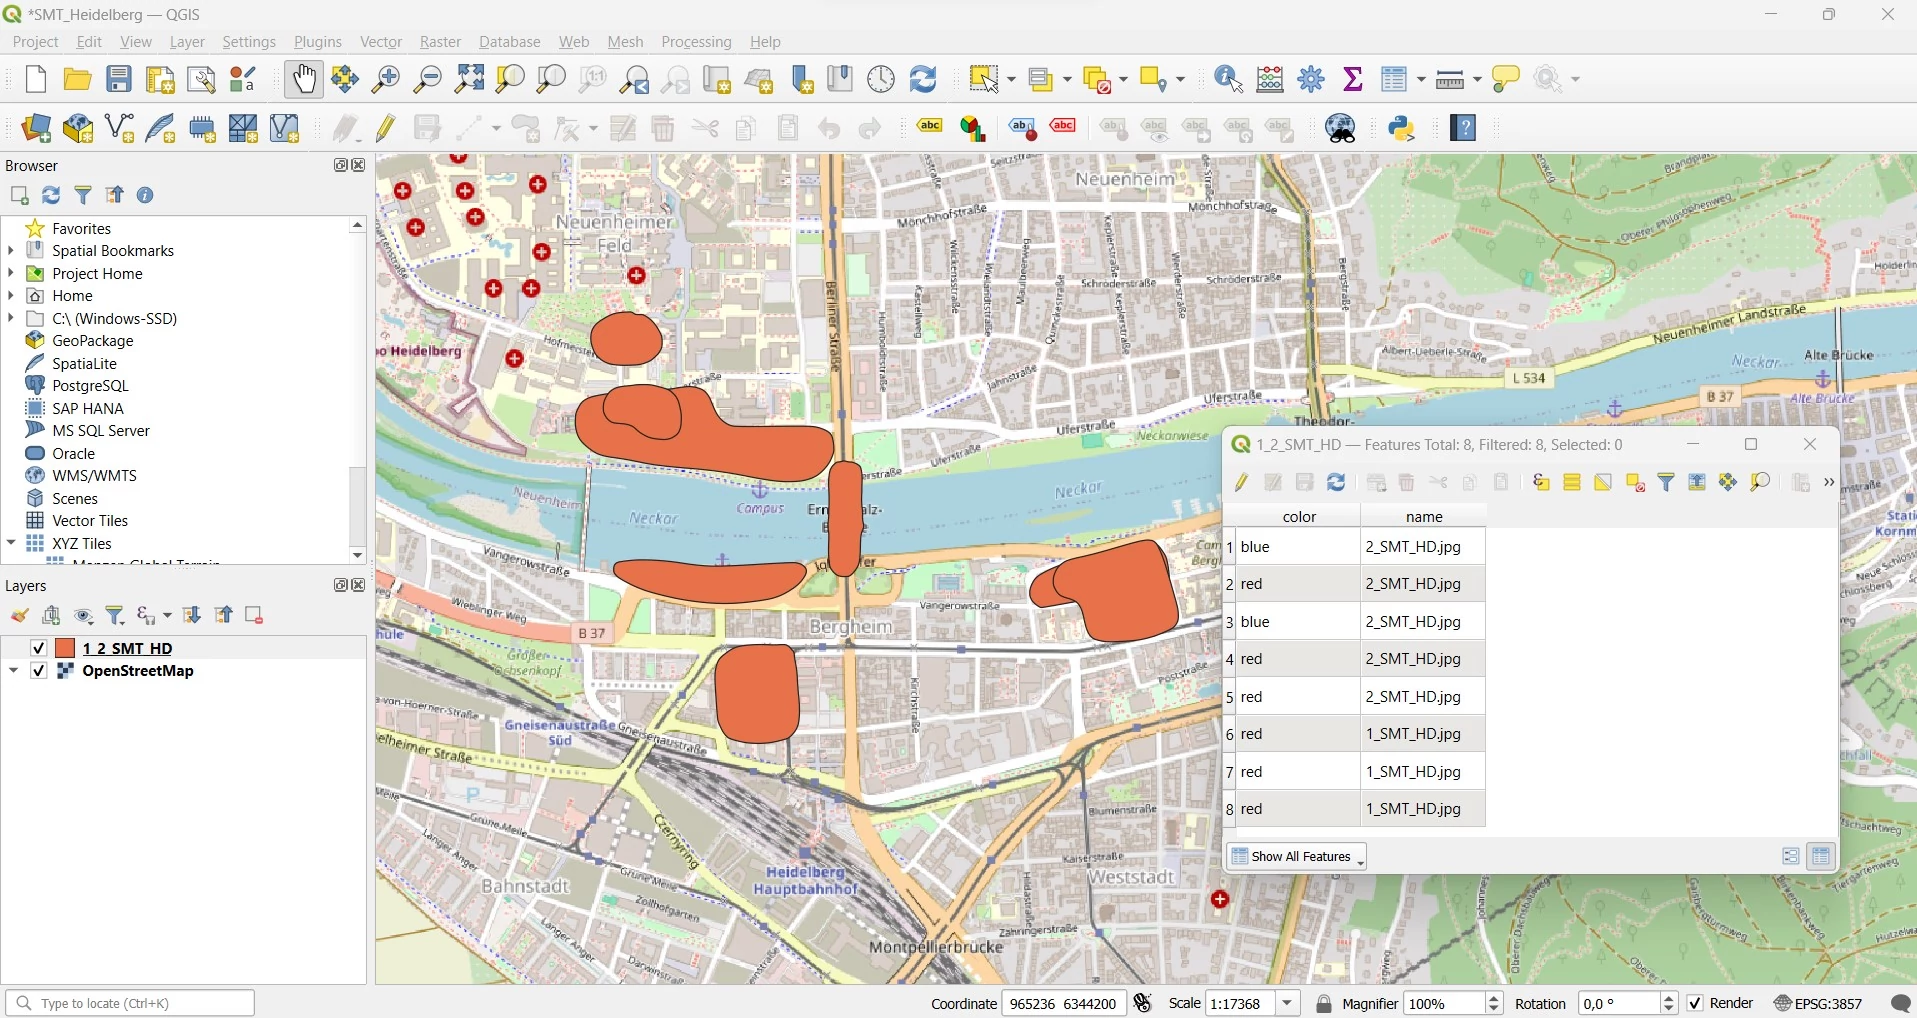
If you open the GeoJSON, you can see the detected markings from all uploaded maps as polygons.
When you check the attribute table, you can see that for each marking, the name of the map and the detected color
are specified. With the help of these attributes, you can style your map or conduct analyses.
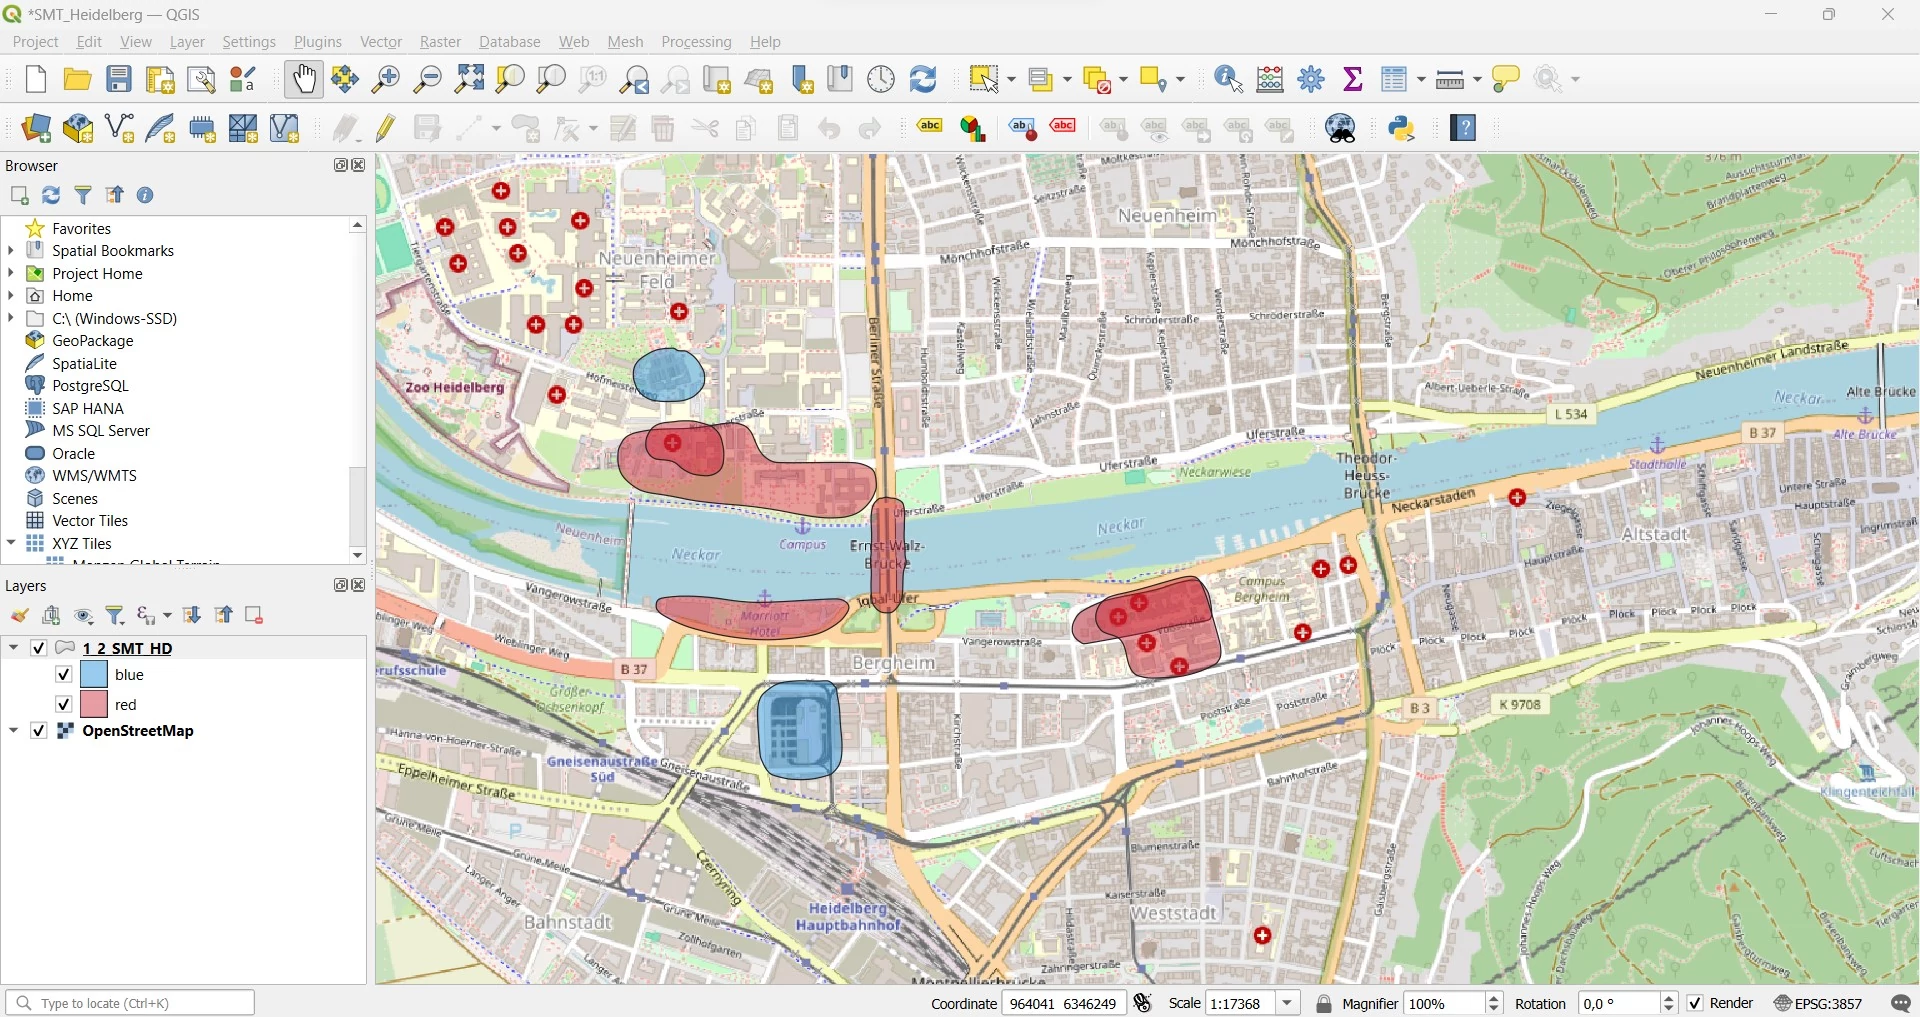
The digitized markings loaded as a GeoJSON layer in QGIS, showing the corresponding attribute table with metadataUsing "color"-field in the metadata to style the vector layer
Recommendations
The GeoTIFF file (raster file) can be opened in a GIS software like QGIS but can not be opened in many browser-based GIS-Applications like uMap:
It can be used, for example, as a background to combine
it with other data or to manually digitize your results yourself in
case some markings are not detected correctly.
The GeoJSON file (vector file) can be opened as well in QGIS as in many browser-based GIS-Applications like uMap:
It can be visualized in a clear and concise map in order to use it for
reporting (see Training Exercise 4)
Based on the vector outputs you can analyze your data and combine it with additional
data (e.g. prepare heatmaps, see Training Exercise 5 )
In QGIS: You can compare the vector output with the raster file to verify the marking detection.
In case features are not detected or are incorrectly detected, you can manipulate your vector file based on the GeoTIFF.
If the imported data looks strange and does not represent the actual markings of
the Sketch Maps, please check your uploaded sketch map files and, if necessary, scan them again
or take new pictures. Please review the recommendations in the sections about the data collection,
then scan, photograph or the upload above and consult our FAQ section about the problems in the colour
detection. If you cannot find your answers there, please contact your Sketch Map Tool focal point in your
organization or the Sketch Map Tool or the Sketch Map Tool user support.
Data storage and security
Map creation
Functionally necessary data storage: We need the original map frame to digitize your Sketch Map.
The map frames of the created maps are stored for 12 months, giving you the opportunity to digitize your Sketch Map in those 12 months.
Paper to GIS
Functionally necessary data storage: Uploaded images of Sketch Maps are stored for processing
(georeferencing and marking detection) until the results are generated.
The results are stored and available for download for a period of 24 hours, after which they are deleted.
Share your data for the Improvement of the Sketch Map Tool
On a voluntary basis, you can enable us to keep your uploaded Sketch Maps beyond processing to further improve the Sketch Map Tool.
If you opt-in by checking the check box you enable us to ...
... keep your uploaded Sketch Maps for future improvements of the Sketch Map Tool such as training
our machine learning models which detect your markings on the uploaded images.
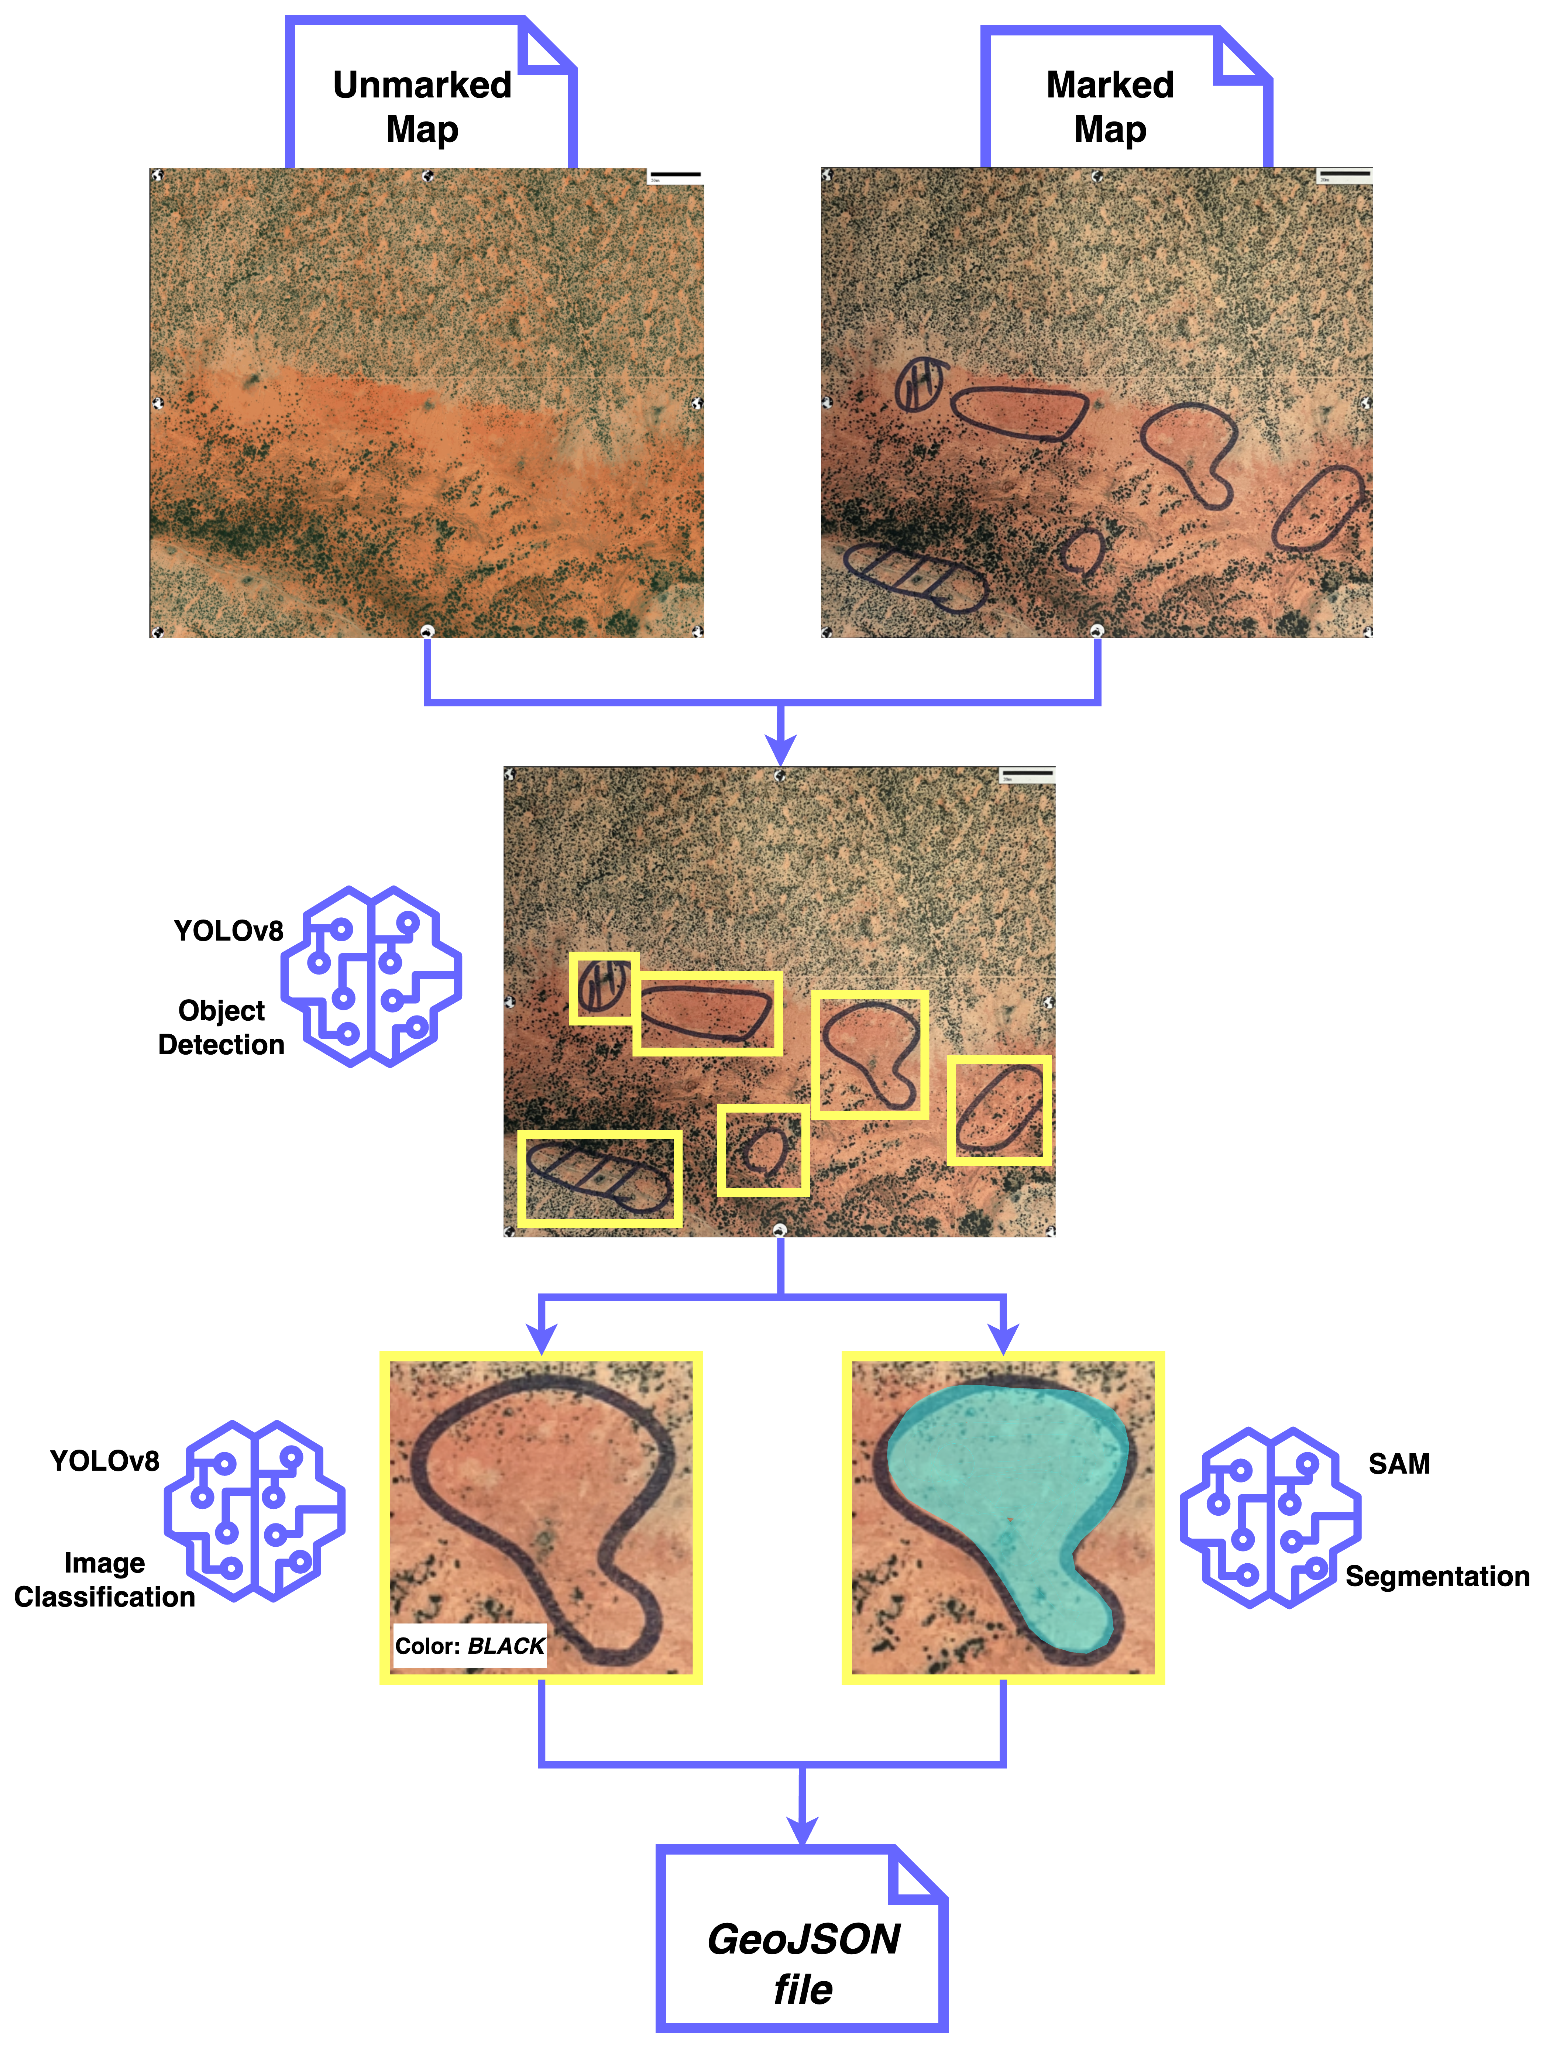
The Sketch Map Tool uses a sequence of machine learning models (SAM and YOLO) to detect the markings on the maps.
These models need to be trained with a lot of real-world examples so they are able to identity the markings correctly.
Further accuracy improvements can be achieved by incorporating additional real-world cases of marked maps into the models.
You can help us here by giving your consent!
For more detailed and technical information take a look at our
GitHub
and the following figure.
If you opt-out by leaving the checkbox unchecked (default) ...
... your uploaded Sketch Maps will be deleted after the results are generated. The results are stored and available for download
for a period of 24 hours, after which they are deleted too.
Basic statistics
To get a better insight into the general usage of the Sketch Map Tool we store anonymous data about the map generation
(date, centroid, layer, version, page format and orientation).
Questions and concerns
If you have further questions or any concerns please reach us via E-Mail.
It is also possible to set-up the Sketch Map Tool on your own server. In this case, please get in touch with the Sketch Map Tool team.
FAQs
What are OSM data?
OpenStreetMap data is freely accessible geodata. You can find out more about it here.
What are the quality levels for OSM data used in the Map Quality Check?
Based on the
HeiGIT ohsome quality API, the roads in the OSM base map data are analyzed automatically in regard to
their Mapping Saturation and Currentness. Please check the chapter 1.2 Map Quality Check for a detailed overview.
For which research questions can the Sketch Map Tool
be used?
The Sketch Map Tool has been primarily developed for research questions related to flooding and disaster risk reduction.
Since then, it has been used world wide for a variety of topics like vulnerability and capacity mapping or risk
mapping in general, city planning, mapping of cultural sites and many more.
Check out our Case Studies to learn more.
How does mapping work with the Sketch Map Tool?
The local population can, for example, draw flooded areas such as streets, parks, etc., on the printed
Sketch Map.
The larger paper formats also allow to hold group discussions about flooded areas. The maps with the markings
can be photographed and uploaded to the tool.
The georeferenced GeoTIFF and GeoJSON can then be further analyzed or used.
Is it possible to find a certain location by coordinates?
In the search field, instead of a place name, you can simply enter your LAT, LON coordinates including
the hemisphere information (e.g. 1.2921° S and 36.8219° E ).
How large can my study area be?
So far the Sketch Map Tool has only been tested on neighborhood or city level. The tool works best for
study areas which are smaller than 50km².
Why is there a QR code and markers the Sketch Maps?
These are required for georeferencing. The QR Code contains the ID of the reference map frame and the bounding box coordinates.
The tool employs computer vision algorithms to match uploaded and reference map frames (mainly based on the markers.)
before it transforms and georeferences the uploaded Sketch Maps.
Can I access my results at a later point in time?
No, the results should always be downloaded directly after using the tool. If you forgot to download the
files, you can simply upload and process the files again.
What do I need to keep in mind for the participatory mapping?
Please make sure not to accidentally draw over markers at the edge as they are needed for automatic map detection.
Use thicker felt-tip pens with intense colors; red, blue, and black work best. Prepare the same set of pens for
all interviewers.
Here
you can download the most important tips and questions for the mapping (summarized in a one-pager).
How does the georeferencing work?
Our georeferencing process employs the Binary Robust Invariant Scalable Keypoints (BRISK)
method from the OpenCV library for feature matching. It begins by extracting bounding box
coordinates and an identification number from a QR code on the uploaded Sketch Map to identify
the corresponding unmarked reference map. Using the BRISK algorithm, the marked Sketch Map is
aligned with the unmarked map. Later, we use the coordinates of the bounding box to transform the
marked map into the world geodetic system (WGS 84), resulting in a georeferenced GeoTIFF file
suitable for geospatial analysis.
The latest version of the Sketch Map Tool leverages advanced Deep Learning models trained to analyze images of
Sketch Maps and identify marked objects within them. Through supervised learning on extensive datasets of labeled images,
these models acquire the ability to distinguish markings from the background of Sketch Maps by analyzing patterns and features.
This enables them to accurately detect and differentiate markings. This predictive capability allows the models
to generalize their understanding and accurately identify markings in new and unseen Sketch Maps.
The Sketch Map Tool also incorporates conventional Computer Vision techniques to precisely position
the Sketch Map within real-world coordinates. Georeferencing images entails detecting and matching specific points,
such as the markers in the corners of the Sketch Maps, between the reference and current input image,
enabling precise spatial alignment. The algorithm detects all markings as either 'Points' or 'Polygons'. Lines are treated as polygons,
and any polygon (whether a line or a shape) below a set size threshold is ultimately classified as a 'Point'.
How can I ensure optimal results when photographing the Sketch
Maps?
The images need to be in JPG or PNG format. The file may not be larger than 500 MB. Georeferencing
works best if you scan the marked Sketch Map with a resolution of 300 dpi.
The photos must be taken from above at a 180 degree angle (parallel above the Sketch Map) to produce the best result.
How do I check if georeferencing is correct?
You can open the TIFF file in a geographic information system (GIS), such as ArcGIS or QGIS, to check
this.
If you upload the file there and insert a basemap (for example the OSM basemap), you can see if the georeferencing
has worked. The Sketch Map should match the base map.
Why does my generated GeoTIFF file look strange?
Please first try to open the file in a geographic information system (GIS) such as ArcGIS or QGIS.
The georeferencing may have worked even if the GeoTIFF file does not look right. If it still appears incorrect in
the GIS,
the map might not have been properly detected by the tool in the photo, which could have several possible causes.
For example, the photo may have been taken from the wrong angle or the markers may have been painted over.
What can I do if the satellite map I printed is too dark?
In case you use a satellite imagery background, please review the color saturation of your image.
If the background is too dark, you might consider to choose OSM as base map or adjust the color saturation in the printer settings before printing.
How long are uploaded Sketch Maps stored?
The uploaded image(s) of your Sketch Map(s) will be stored on our server for processing (georeferencing and marking detection)
until the results are generated. If you consent, the image(s) will be stored long term for future improvements of the Sketch Map Tool such as
training our machine learning models which detect your markings on the uploaded images.
If you do not give consent, the uploaded images will be deleted after the results are generated.
The results are stored and available for download for a period of 24 hours, after which they are deleted too.
How much time do I have to upload the Sketch Maps for the digitization?
This is possible for up to 12 months after your maps have been created, after which the digitization will no longer work.